
How the Crack Spread Is Calculated
The 3-2-1 crack spread estimates refining margins: two barrels of gasoline plus one of diesel minus three of crude, divided by three. Example: $32 a barrel.
The crack spread is the gap between crude and refined product prices, a guide to refining margins. The 3-2-1 version assumes three crude barrels yield two of gasoline and one of diesel: (2 × gasoline × 42 + diesel × 42 − 3 × crude) ÷ 3. At $80 WTI, $2.50 gasoline and $3.00 diesel, it is $32.
The formula
3-2-1 crack = [(2 × gasoline $/gal × 42) + (1 × diesel $/gal × 42) − (3 × crude $/bbl)] ÷ 3
Worked example
- WTI: $80 a barrel
- Gasoline: $2.50 a gallon → $105 a barrel
- Diesel: $3.00 a gallon → $126 a barrel
- Products: 2 × $105 + $126 = $336
- Crude: 3 × $80 = $240
- Crack: ($336 − $240) ÷ 3 = $32 a barrel
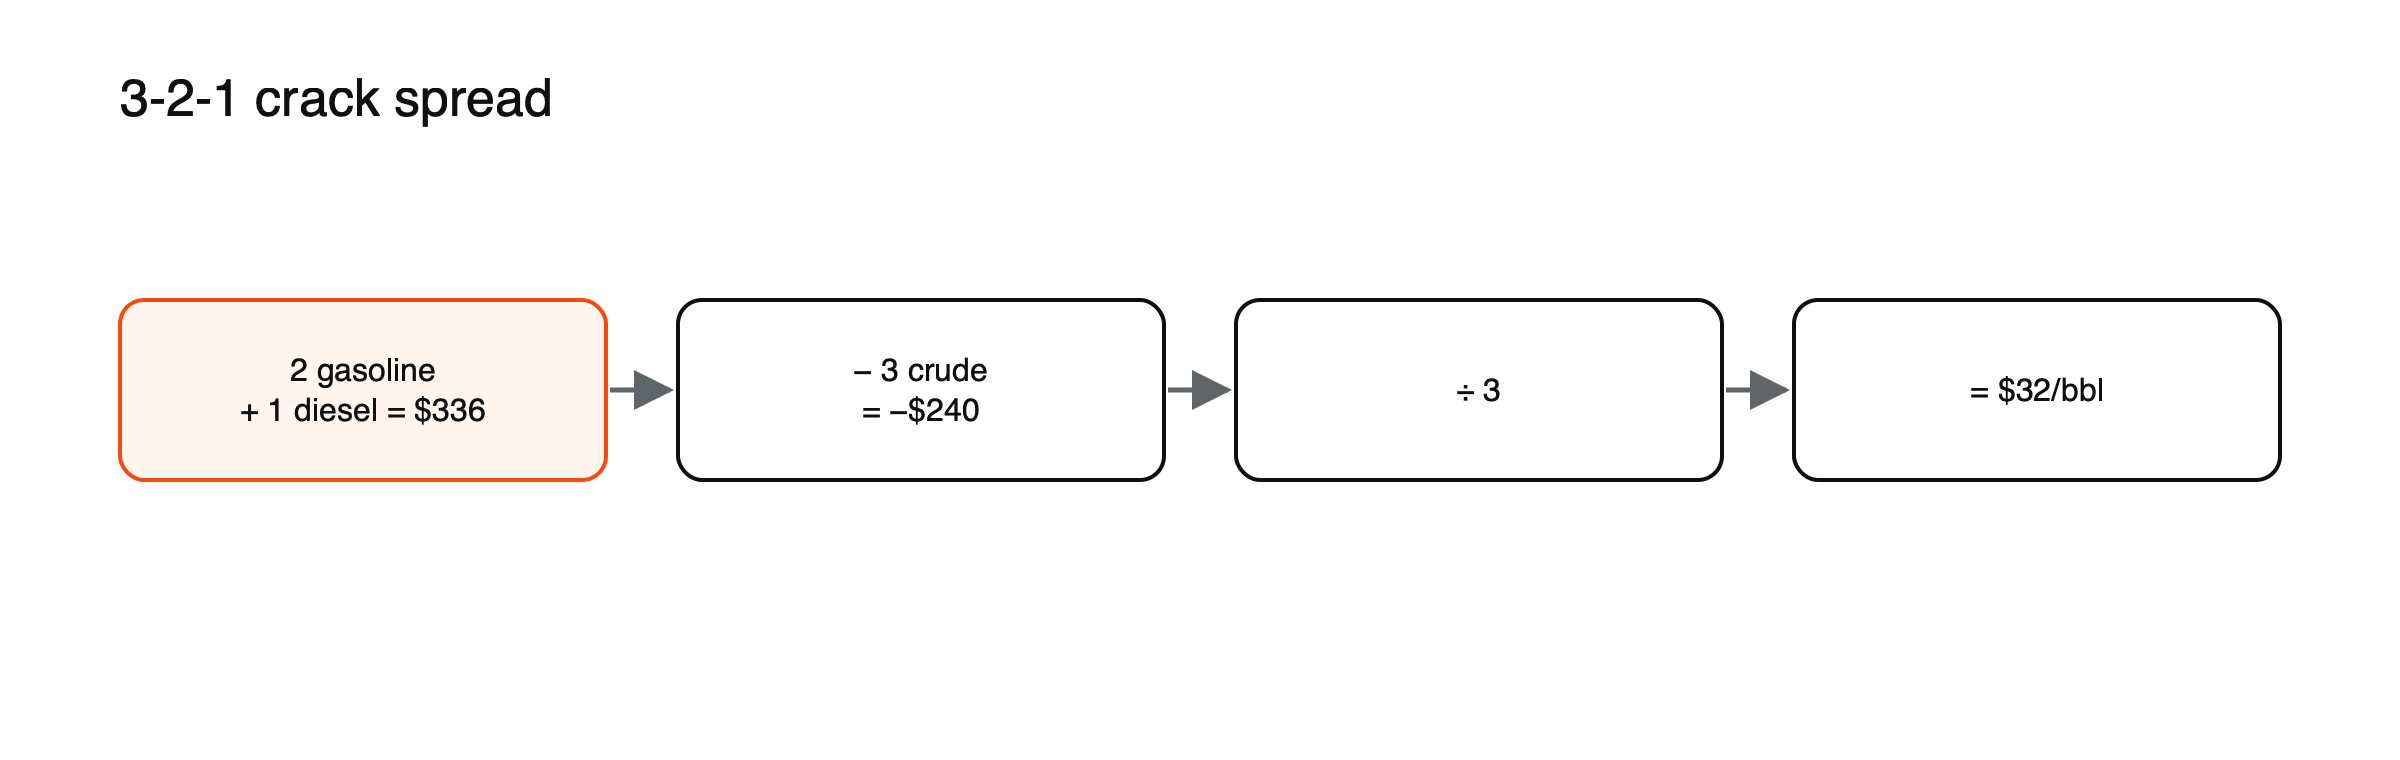
Figure: The 3-2-1 crack spread (example values).
(Example values.)
Worked example 2: a narrower spread
- WTI: $70 a barrel
- Gasoline: $2.20 a gallon → $92.40 a barrel
- Diesel: $2.60 a gallon → $109.20 a barrel
- Products: 2 × $92.40 + $109.20 = $294.00
- Crude: 3 × $70 = $210
- Crack: ($294.00 − $210) ÷ 3 = $28 a barrel
Crude is $10 cheaper than in the first example, but product prices fell too, so the refining margin is only $4 narrower. (Example values.)
Single-product cracks
Traders also follow simpler spreads for each product. Using the first example’s prices, the gasoline crack is $2.50 × 42 − $80 = $25 a barrel, and the diesel crack is $3.00 × 42 − $80 = $46 a barrel. Comparing the two shows which product is driving refining margins: in winter, or when diesel supply is tight, the diesel crack often leads; ahead of summer, gasoline usually strengthens.
Other recipes
Some analysts use a 5-3-2 crack, assuming five barrels of crude yield three of gasoline and two of diesel. With the first example’s prices, it is (3 × $105 + 2 × $126 − 5 × $80) ÷ 5 = $33.40 a barrel. Refineries in different regions, and those processing heavier crudes, are better described by different recipes, so no single crack spread fits every refinery.
How to read it
A wide crack means refiners earn more per barrel and may run harder, supporting crude demand; a narrow crack can lead refiners to cut runs. Over 1986–2026 the 3-2-1 averaged about $12 a barrel, but it reached about $59 in July 2026 amid tight product markets.
July 2026
On July 6, 2026, the 3-2-1 crack stood at about $59.45 a barrel, roughly five times its long-run average of about $12. Product markets were tight after months of disruption to Gulf exports, which affected refined products as well as crude, and US refiners earned exceptional margins. Wide cracks like these encourage refiners to run at high rates, which in turn supports demand for crude. See what moves crude oil prices.
Seasonality
Gasoline cracks tend to strengthen before the summer driving season; distillate cracks in winter.
Limits
It is a simplified recipe: real refineries have different yields and costs, and a wide crack is not the same as profit. See what moves crude oil prices, how hurricanes and weather move energy prices and how commodity CFDs work.
Why the crack matters for crude prices
Refiners are the buyers of crude oil, so their margins affect crude demand. When cracks are wide, refiners buy more crude to process, supporting its price. When cracks collapse, they cut runs, and crude can weaken even if supply has not changed. Watching the crack alongside inventory data helps explain moves in crude that are not driven by production news. See how to read the weekly EIA oil inventory report.
Trading the crack
Some traders take positions on the crack itself, buying product futures and selling crude futures, or the reverse. Retail CFD traders rarely have access to product contracts, but they can use the crack as an indicator: a widening crack with rising refinery runs is supportive for crude, while a narrowing crack with falling runs can warn of weaker crude demand ahead.
Common calculation errors
- Forgetting to convert product prices from gallons to barrels.
- Mixing benchmarks, such as Brent crude with US product prices, without noting the difference.
- Treating the crack as a refiner’s profit, ignoring operating costs.
Refining in brief
A refinery first heats crude oil and separates it by boiling point into fractions, from light gases and gasoline to diesel, jet fuel and heavy residues. More complex refineries then use additional units to break heavy fractions into lighter, more valuable products, the process known as cracking. Light, sweet crudes yield more gasoline and diesel with less processing, while heavy, sour crudes need more complex and costly equipment. That is why different refineries earn different margins from the same crack spread.
A year of cracks, illustrated
Suppose the gasoline crack averages $18 a barrel in January, rises to $30 by May as refiners prepare for the summer driving season, and eases back to $20 by October. The diesel crack follows a different path, strongest in winter when heating oil demand peaks. (Illustrative figures.) A trader who knows these seasonal patterns can tell whether a move in the crack is normal for the time of year or a sign of unusual tightness or weakness.
Refinery outages
When a large refinery shuts unexpectedly, because of a fire, a storm or a breakdown, product supply falls while crude demand from that plant disappears. Product prices rise and the crack widens, sometimes sharply in the affected region. Planned maintenance, usually in spring and autumn, has a similar but more predictable effect. See how hurricanes and weather move energy prices.
Cracks in other regions
The 3-2-1 crack based on US benchmarks is the best known, but Europe and Asia have their own refining margins, often calculated from Brent crude and local product prices, such as those in Northwest Europe or Singapore. These margins can diverge because of local demand, export flows and refinery capacity. Comparing them shows where refined products are tightest and where cargoes are likely to flow.
What it means for consumers
A wide crack means fuel prices at the pump are high relative to crude oil. Drivers and airlines feel it even when crude prices are stable, and governments sometimes respond with tax changes or reserve releases of refined products. When cracks narrow, falling crude prices pass through to fuel more fully.
The crack and inventories together, illustrated
Suppose the weekly inventory report shows gasoline stocks falling for a third week while refinery utilization is already high, and the gasoline crack widens from $22 to $28 a barrel. (Illustrative figures.) Refiners have little room to raise output further, so product prices must rise to ration demand. Crude may rise too, but by less, because refiners cannot buy much more of it. Reading the two together tells a trader that the tightness lies in refining, not in crude supply, which matters for how long the move might last.
The crack over time
Over 1986–2026, the 3-2-1 crack averaged about $12 a barrel, but it has spent long periods well above and below that level. It tends to spike after hurricanes hit Gulf Coast refineries, during periods of tight diesel supply such as 2022, and when refining capacity is lost to closures. It tends to collapse when fuel demand falls sharply, as in early 2020. Its long-run average is a reference point, not a level it must return to. Comparing the current crack with the same month in past years, rather than with the long-run average, gives a fairer sense of whether margins are unusually high or low for the season. Seasonal comparisons remove much of the noise in weekly crack readings.
Frequently asked questions
Why is it called a crack spread?
Because refining breaks, or cracks, crude oil into lighter products such as gasoline and diesel, and the spread measures the value added by that process.
Can the crack spread be negative?
In rare cases, yes, when product prices fall below the cost of crude, usually in periods of collapsing fuel demand. Refiners then cut runs sharply.
Leverage, margin and cost figures in this article are example values for illustration. Actual terms depend on the provider, the instrument and the rules in your country.
This article is educational content and does not constitute financial, investment, legal or tax advice. Digital assets are volatile and you may lose the amount you invest.
Sources
- 3-2-1 crack spread explained (formula; about $59.45 a barrel on July 6, 2026; averaged roughly $12 over 1986–2026) — Eco3min
- Crack spread study (three barrels of crude yield two of gasoline and one of heating oil; 42 gallons per barrel; seasonality) — eSignal
- Crack spreads: the 3-2-1 formula (worked example; a crack spread is not profit) — Ryan O’Connell Finance