
What Happened to Stock Markets in the March 2020 Crash?
The S&P 500 fell about 34% in 23 trading days in 2020, triggering circuit breakers four times, then bottomed on March 23 and recovered by August.
The March 2020 stock market crash was the fastest fall into a US bear market. As COVID-19 spread, the S&P 500 fell about 34% in 23 trading days to March 23, circuit breakers halted trading four times and the index fell about 12% on March 16. After massive policy support, it recovered its losses by August.
Timeline
- February 19: the S&P 500 hits a record high.
- Late February: virus fears spread; stocks fall sharply.
- March 9: an oil price war adds to the panic; the first circuit breaker of the month halts trading.
- March 16: the S&P 500 falls about 12%; the VIX closes at a record 82.69.
- March 23: the Fed announces open-ended asset purchases; stocks bottom.
- August 2020: the S&P 500 regains its February high.
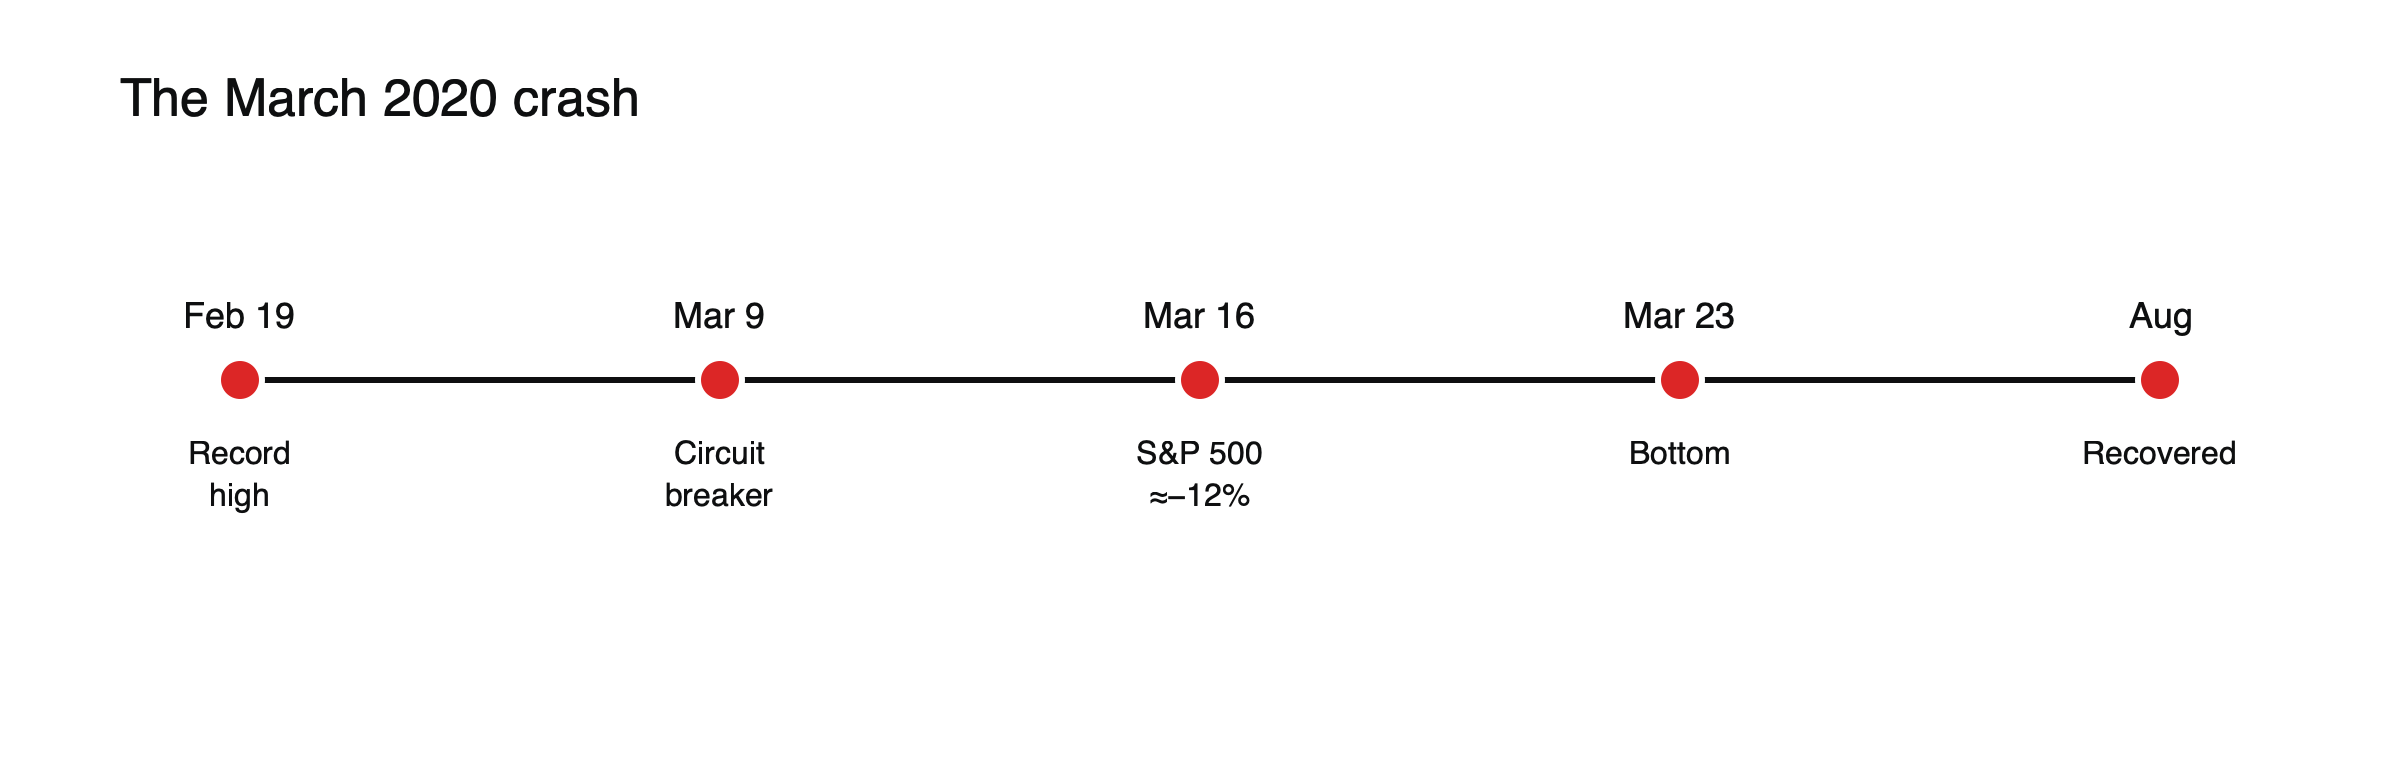
Figure: The fastest bear market.
Circuit breakers in March 2020
| Date | Trigger |
|---|---|
| Monday, March 9 | Oil price war and virus fears; 15-minute halt after a 7% fall |
| Thursday, March 12 | Travel restrictions announced; second halt |
| Monday, March 16 | Emergency Fed cut fails to calm markets; third halt |
| Wednesday, March 18 | Fourth halt in eight trading days |
Before 2020, the market-wide circuit breakers in their modern form had been triggered only once, in 1997. Four halts in two weeks showed how extreme conditions had become. See how stock market circuit breakers work.
The oil price war
On the weekend of March 7–8, talks between Saudi Arabia and Russia on cutting oil output collapsed, and Saudi Arabia slashed prices and promised to raise production. Oil prices plunged on Monday, March 9, adding an energy shock to the pandemic shock. Energy shares and the currencies of oil exporters fell sharply.
What made it unusual
- Speed: a fall that took months in past bear markets took weeks.
- A dash for cash: even Treasuries and gold sold off briefly as investors raised cash.
- Policy response: rate cuts to zero, unlimited asset purchases and fiscal support on a huge scale.
The policy response
The Federal Reserve cut interest rates to near zero on Sunday, March 15, and on March 23 promised asset purchases without a set limit, along with programs to support corporate bond markets. Congress passed a fiscal package of about $2.2 trillion at the end of March. Governments elsewhere took similar steps. The scale and speed of support marked the turning point for markets, even though the economic damage from lockdowns was only beginning. See how central bank decisions move currencies.
Winners and losers
Airlines, cruise operators, hotels, energy companies and banks were hit hardest. Technology companies, online retailers and video-conferencing providers recovered quickly and then surged, as lockdowns accelerated the shift to digital services. The divergence helped the Nasdaq 100 recover its losses well before many other indices and increased the concentration of US indices in large technology companies.
Lessons
Diversification can fail for days in a liquidity panic; volatility spikes widen spreads and gaps; policy can turn markets faster than the economy. See how the 2020 crash hit every asset class, what the VIX is and what moves stock market indices.
The recovery
From the low on March 23, the S&P 500 rose rapidly, regaining its February record by August 2020, one of the fastest recoveries from a bear market on record. Investors who sold near the bottom missed much of the rebound. The speed of both the fall and the recovery was unprecedented.
Index CFDs during the crash
Index CFD traders faced wide spreads, large gaps at the open and margin calls as prices swung several percent a day. Some providers raised margin requirements during the period, reducing the leverage available. Positions sized for normal conditions could be closed out on a single bad day. See what margin calls and stop-outs are.
Before the crash
On February 19, 2020, the S&P 500 closed at a record, with volatility low and investors confident about the economy. Reports of the new virus had spread from China for weeks, but many assumed its impact would remain limited. When cases rose rapidly in Italy and elsewhere in late February, that assumption collapsed, and markets began to price a global shutdown within days.
How fear spread across markets
The sell-off moved quickly from shares to every corner of finance. Credit spreads widened sharply as investors worried about corporate defaults, oil prices collapsed, emerging market currencies fell and the dollar surged as companies and investors around the world scrambled for dollars. For a few days, almost every asset fell together, a rare event that undermined the usual benefits of diversification.
Stress in the Treasury market
Even US government bonds, usually the safest assets, came under pressure in mid-March as investors and funds sold them to raise cash. Yields jumped instead of falling, and trading conditions deteriorated in what is normally the world’s most liquid market. The Federal Reserve’s massive purchases of Treasuries were aimed partly at restoring order to this market.
The corporate bond market
Companies, especially those with weaker credit, found it hard to borrow as investors fled corporate bonds. When the Fed announced it would buy corporate bonds, a step it had never taken before, borrowing conditions improved quickly, and companies raised record amounts of debt in the following months, helping them survive the shutdown.
Volatility at record levels
The VIX closed at a record 82.69 on March 16, 2020, the day the S&P 500 fell about 12%. Daily swings of 5% or more in either direction became common for several weeks, conditions in which index CFD positions could gain or lose their margin many times over in days. See what the VIX is.
Common misreadings
- Assuming safe havens always rise in a crash.
- Believing markets wait for the economy to recover before rising.
Earnings and prices diverge
Company profits collapsed in the second quarter of 2020 as lockdowns shut large parts of the economy, yet share prices were already rising strongly by then. Markets were looking ahead to recovery, supported by low interest rates, government spending and the expectation of vaccines. The gap between weak current earnings and rising prices confused many investors and showed again that markets price the future rather than the present.
A wave of new traders
Lockdowns, stimulus payments and commission-free trading apps brought millions of new individual investors into the market during 2020. Their buying contributed to the rebound in shares and to sharp rises in some popular stocks, setting the stage for the meme stock episodes of early 2021. See what happened in the GameStop short squeeze.
How long the rally lasted
The recovery that began in March 2020 continued through 2021, with US indices reaching repeated records, before rising inflation and interest rates brought a decline in 2022.
Lessons for future crises
March 2020 showed that the most dangerous moments can arrive suddenly from outside finance, that liquidity can vanish even in the deepest markets and that policy responses can be large and fast. For traders, the practical lessons are to keep leverage low enough to survive several extreme days in a row, to expect spreads and margin requirements to rise in a crisis and to recognize that the sharpest rebounds often begin while the news is still at its worst. Those who had cut risk, kept cash in reserve and avoided forced selling were best placed to benefit when markets turned in late March.
Frequently asked questions
How fast was the fall?
The S&P 500 fell about 34% in 23 trading days, the fastest decline from a record into a bear market in its history.
Why did gold and bonds fall too?
In the most acute days, investors sold almost everything to raise cash, including traditional safe havens, before central bank support restored order.
This article is educational content and does not constitute financial, investment, legal or tax advice. Digital assets are volatile and you may lose the amount you invest.
Sources
- COVID-19 market crash 2020 (S&P 500 −34% in 23 trading days; bottom March 23 with unlimited QE; recovered by August) — Fin Still
- Stock market circuit breakers (triggered four times in March 2020) — Schwab
- What investors need to know about the VIX (record close on March 16, 2020; S&P 500 −11.98%) — John Hancock Investment Management
- March market madness (dash for cash; yields jumped) — ETF.com