
Which Currency Pairs Are the Most Volatile?
Yen crosses such as GBP/JPY and exotics such as USD/TRY and USD/ZAR move the most. How volatility is measured and why it matters for risk and trading costs.
The most volatile currency pairs tend to be yen crosses such as GBP/JPY and AUD/JPY, commodity pairs such as AUD/USD, and exotics such as USD/TRY. GBP/JPY can move about 150 pips on an average day against roughly 80 for EUR/USD, and exotics far more. More volatility means bigger moves, wider spreads and more risk.
How volatility is measured
- Average daily range: the typical distance between a day’s high and low, in pips.
- Average true range (ATR): a smoothed measure over a period such as 14 days.
- Percentage change: useful for comparing pairs at very different price levels.
Typical ranges (one estimate)
| Pair | Average daily range |
|---|---|
| EUR/USD | about 80 pips |
| EUR/GBP | 50–80 pips |
| AUD/JPY | 70–100 pips |
| GBP/AUD | 100–150 pips |
| GBP/JPY | about 150 pips |
| USD/ZAR | 1,000–1,500 pips |
| USD/TRY | 1,000–2,000 pips |
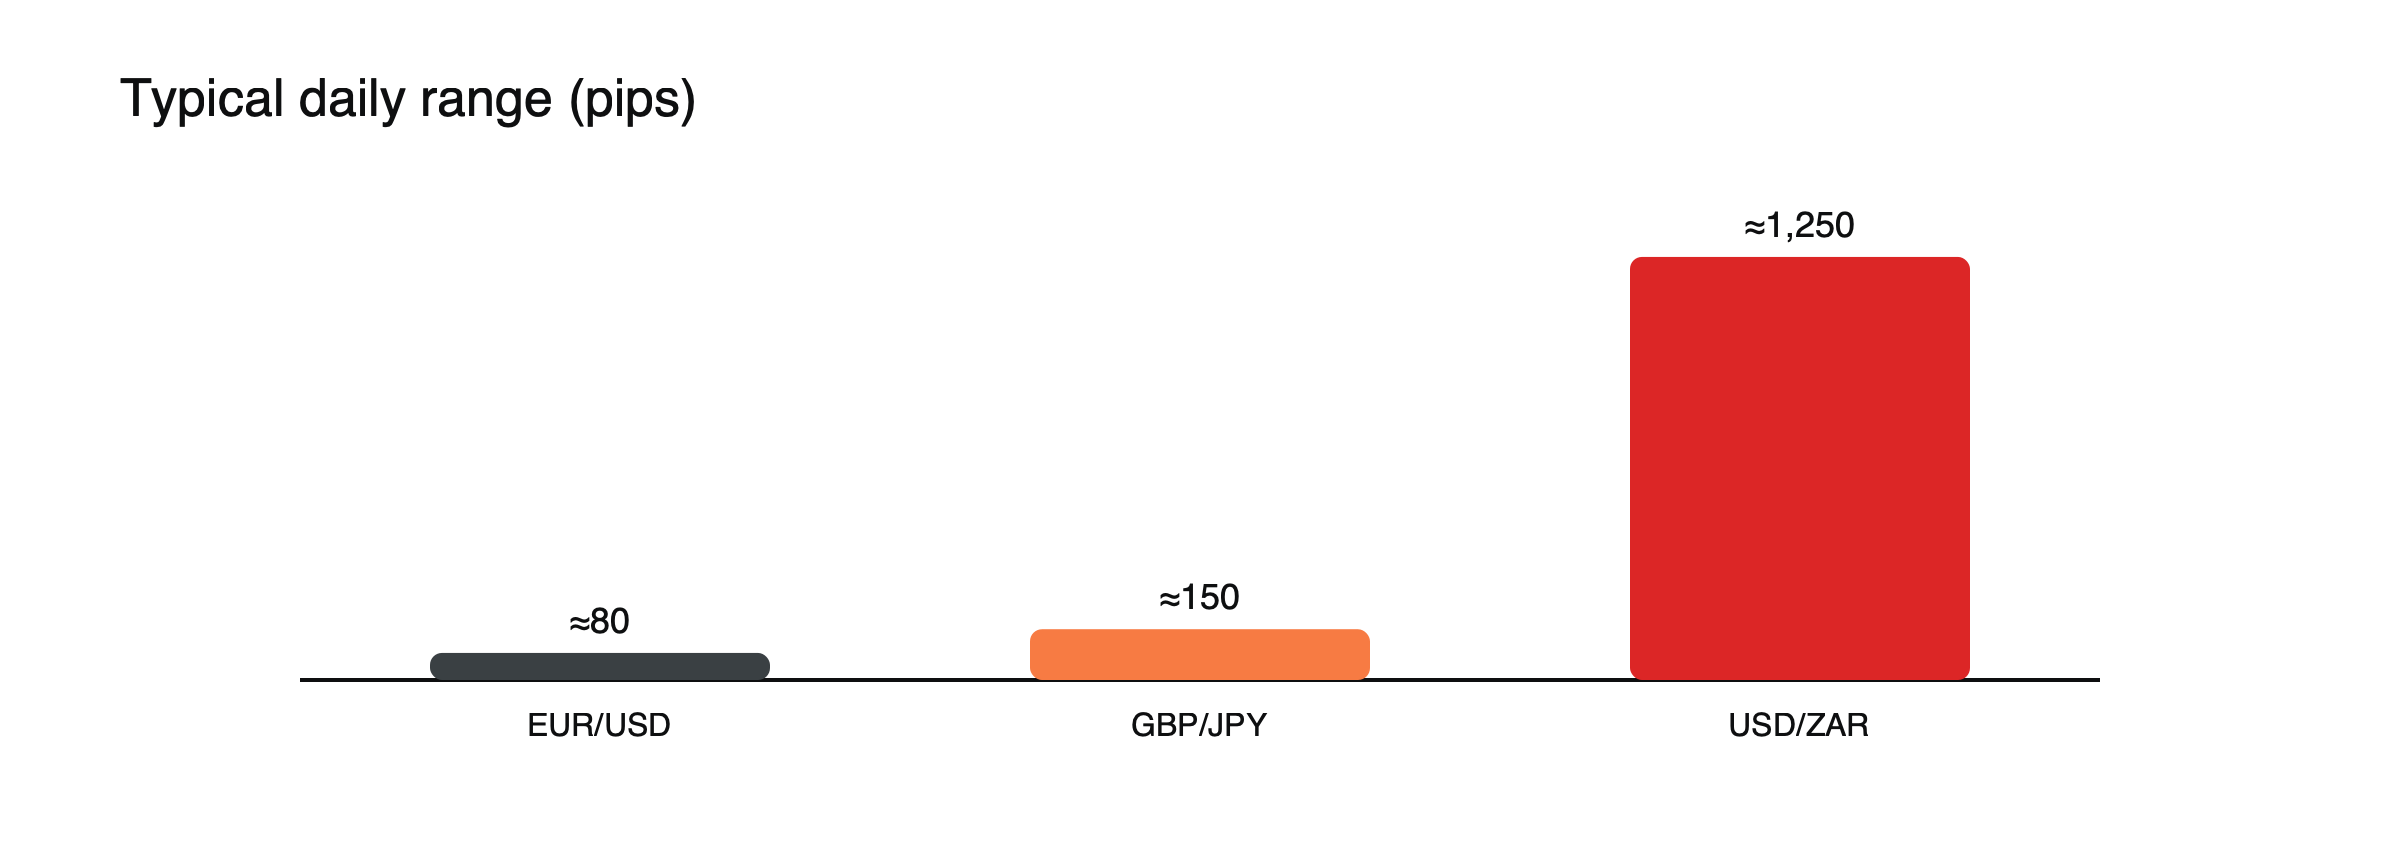
Figure: Typical daily ranges (USD/ZAR shown at the midpoint of a published range). Source: Dukascopy.
Ranges change with market conditions; treat these as a guide.
Pips can mislead: think in percentages
Pip counts make pairs at different price levels hard to compare. An 80-pip day in EUR/USD at 1.1000 is a move of about 0.73%. A 150-pip day in GBP/JPY at 190.00, where a pip is 0.01, is about 0.79%, not twice as large. For an exotic pair such as USD/ZAR trading near 18.00, a 1,000-pip day is a move of about 0.56%. (Illustrative prices.) Measured this way, the everyday gap between majors and some exotics is smaller than pip figures suggest; what sets exotics apart is the size of their occasional jumps, which can be many times their normal range.
Average true range, in practice
Average true range smooths a pair’s daily movement over a period, often 14 days, and includes gaps between one day’s close and the next day’s open. Suppose GBP/JPY’s 14-day ATR is about 120 pips. A trader who wants a stop outside normal noise might place it about one and a half times that distance away, roughly 180 pips, and size the position accordingly. When ATR rises, the same approach automatically widens stops and shrinks positions.
Why some pairs move more
- Yen crosses: combine a risk-sensitive currency with the yen, which often moves the other way in stress.
- Commodity currencies: AUD, NZD and CAD react to commodity prices.
- Exotics: thinner markets, political risk and high inflation.
Sizing for volatility, worked through
Suppose you are willing to lose $100 on a trade and set stops at about one and a half times the typical daily range. (Illustrative figures.)
- EUR/USD, range about 80 pips: stop about 120 pips; at $10 per pip per lot, size ≈ 0.08 lots.
- GBP/JPY, range about 150 pips: stop about 225 pips; at about $6.67 per pip per lot with USD/JPY near 150, size ≈ 0.07 lots.
The more volatile pair gets a smaller position so that the money at risk stays the same. Trading the same lot size on both would quietly double the risk on the more volatile one. See how to calculate forex position size.
Volatility comes in clusters
Calm periods tend to be followed by calm and turbulent periods by turbulence. A pair that has been quiet for weeks can suddenly double its daily range around a central bank surprise or a political event, and stay volatile for some time. Recalculating ranges regularly, rather than relying on long-run averages, keeps stops and sizes in line with current conditions.
What options markets expect
Currency options prices contain the market’s expectation of future volatility, known as implied volatility. When one-month implied volatility for a pair jumps, traders are paying more for protection, which often signals that a big move is expected, for example ahead of an election or a central bank meeting. Watching implied volatility alongside past ranges gives a forward-looking view.
What it means for traders. Higher volatility needs wider stops and smaller positions for the same risk, and costs more in spreads. See how to size a CFD position using risk per trade and major, minor and exotic currency pairs. For the bigger picture, read how the forex market works.
Volatility and costs
Volatile pairs usually carry wider spreads, partly because dealers face more risk. What matters is the spread relative to the typical move: a 3-pip spread on a pair that moves 150 pips a day is a smaller share of the range than a 1-pip spread on a pair that moves 40 pips. Comparing the spread with the average daily range shows which pairs are cheap or expensive to trade for a given strategy.
Is more volatility better?
Larger moves offer more profit potential per trade, but also larger losses, wider stops and more emotional pressure. For many traders, especially those starting out, steadier major pairs make it easier to follow a plan. More volatility suits only those who size positions carefully and can tolerate bigger swings without changing their plan mid-trade.
Volatility through the day
Volatility is not spread evenly across the day. Most pairs move least in the hours when their home markets are closed and most when those markets open or overlap. GBP/JPY can be relatively quiet in the late New York session and lively during the London morning; AUD/USD often reacts sharply to Australian and Chinese data released in Asian hours. Measuring ranges by session, rather than by whole day, helps match stops and expectations to the hours you actually trade. See forex trading sessions.
Pairs that look calm but are not
Some pairs show very low daily volatility because their currencies are pegged or tightly managed. Their charts look safe, but the risk is concentrated in rare breaks that can move them more in a day than a volatile pair moves in a month. Low recent volatility in a managed currency is not evidence of low risk. See fixed vs floating exchange rates.
Volatility and leverage limits
Retail leverage caps in the EU depend on which currencies make up a pair, not on how volatile it is. GBP/JPY combines two of the six currencies classed as major, so it carries the same 30:1 cap as EUR/USD, even though it moves more. Pairs including the Australian dollar or emerging market currencies fall under the 20:1 limit. The cap is therefore not a guide to risk: a volatile pair at maximum leverage can move an account more than a calm one. Sizing by the pair’s range, rather than by the leverage allowed, keeps risk comparable.
A volatility checklist
- What is the pair’s current average range, in pips and in percent?
- Is volatility rising or falling compared with last month?
- Are major events due that could expand the range?
- Is the position sized for the current range, not last year’s?
Common misreadings
- Comparing pips across pairs priced very differently.
- Assuming a quiet pair will stay quiet.
- Choosing volatile pairs for excitement rather than for a plan.
Frequently asked questions
Which major pair is usually the most volatile?
Among the majors, pairs involving commodity currencies such as the Australian dollar often move more than EUR/USD, while yen crosses such as GBP/JPY are frequently among the most volatile widely traded pairs.
Does high volatility mean high risk?
It means larger price swings. Whether that becomes high risk depends on position size and leverage: a small position in a volatile pair can carry less risk than a large position in a calm one.
This article is educational content and does not constitute financial, investment, legal or tax advice. Digital assets are volatile and you may lose the amount you invest.