
How to Calculate Profit and Loss on an Oil CFD
Oil CFD P&L = price change per barrel × barrels, minus spread, financing and roll costs. Worked examples: a 100-barrel long and a 50-barrel short position.
Oil CFD profit and loss is the price change per barrel times barrels: P&L = (exit − entry) × barrels for a long, reversed for a short, before costs. Buying 100 barrels at $80.00 and selling at $83.50 gains $350; shorting 50 at $75.00 and closing at $77.00 loses $100. Then subtract costs.
The formula
- Long: (exit − entry) × barrels
- Short: (entry − exit) × barrels
- Net = gross P&L − spread − financing ± roll adjustments
Worked example 1: long
- Buy 100 barrels at $80.00; sell at $83.50
- Gross: 3.50 × 100 = +$350
- Position value $8,000; margin at 10:1 = $800, so the gain is about 44% of margin.
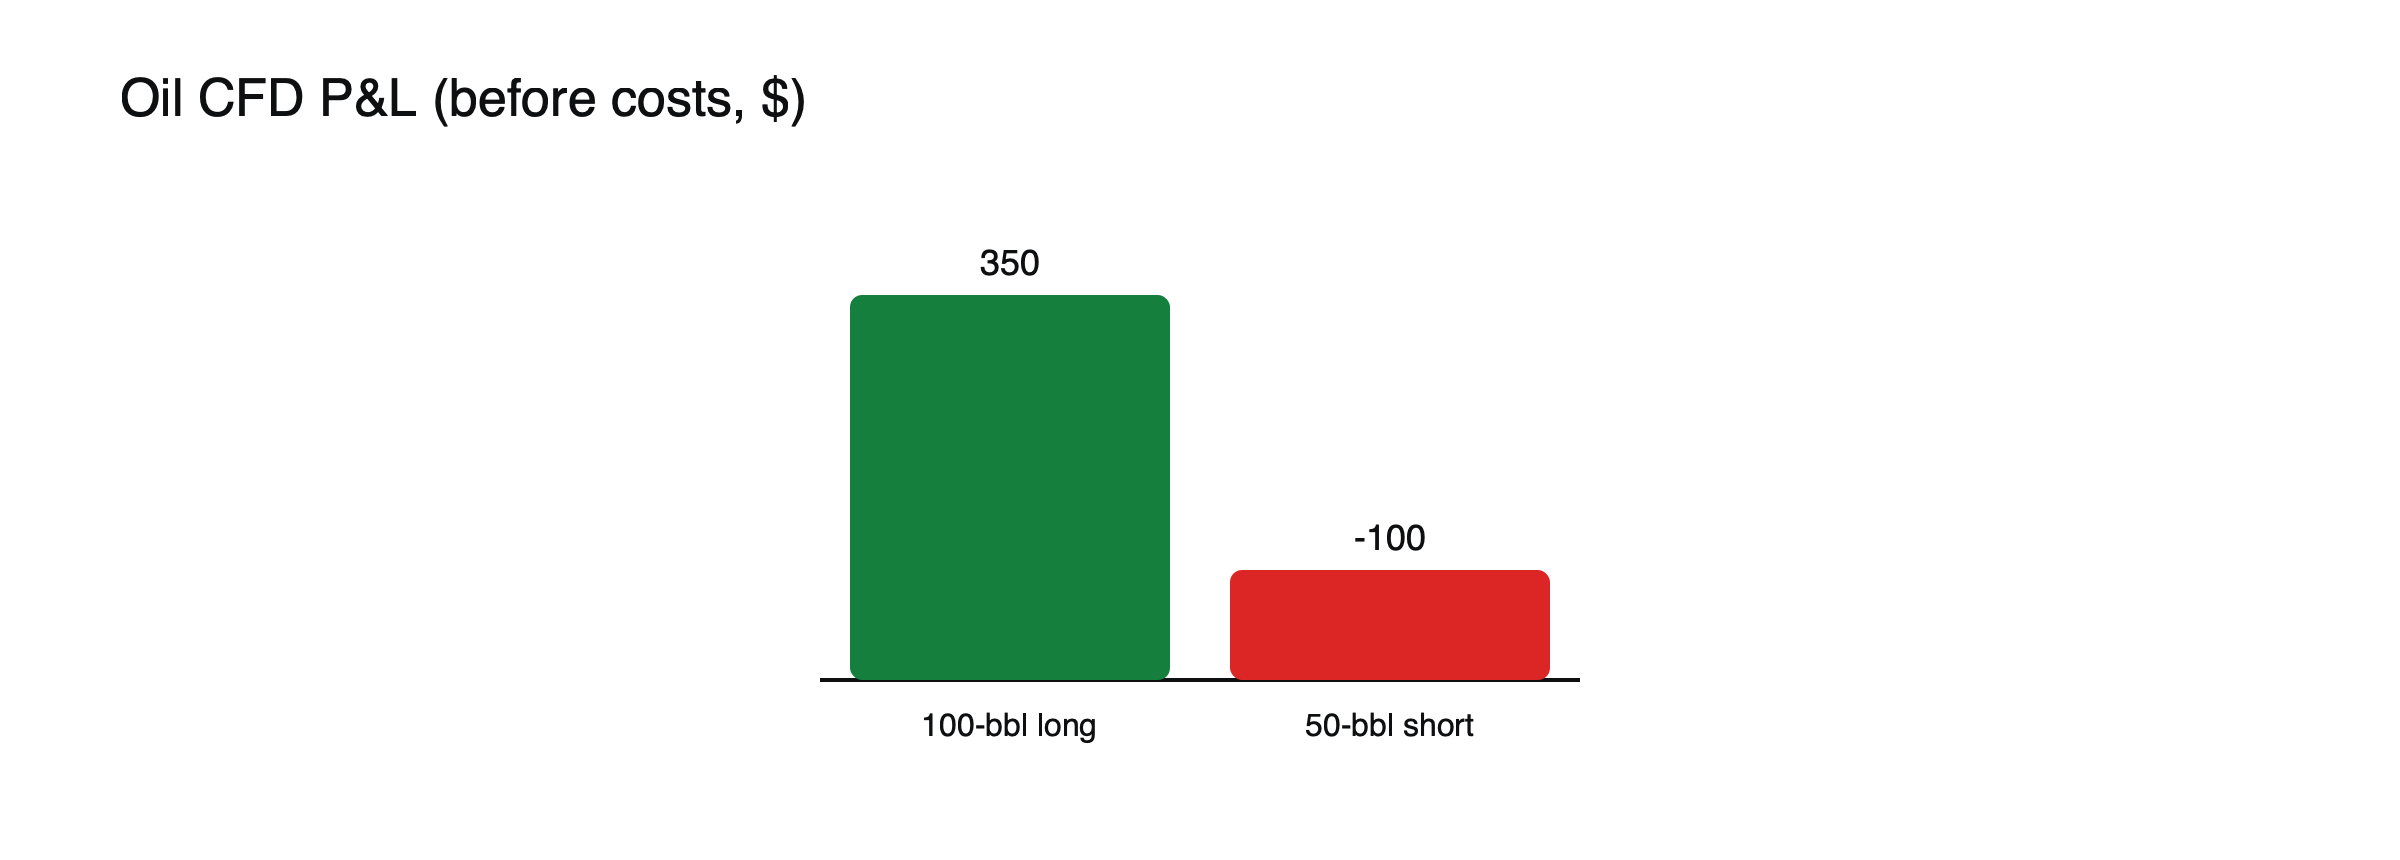
Figure: The two worked examples, before costs.
Worked example 2: short
- Sell 50 barrels at $75.00; price rises to $77.00
- Gross: (75.00 − 77.00) × 50 = −$100
(Example values.)
Worked example 3: net of costs
Return to example 1: a long of 100 barrels from $80.00 to $83.50, a gross gain of $350. The spread was about $0.04 a barrel, or $4, and the position was held for three nights on a cash CFD with financing at an illustrative 6% a year, about $3.95. Net result: about $342. Costs were small here, but on a trade aiming for a $0.50 move, the same costs would take about a sixth of the gain.
Worked example 4: an account in euros
The same $350 gross gain, converted into euros at EUR/USD 1.1000, is about €318. Oil CFDs are priced in dollars, so traders with accounts in other currencies see their results move with the exchange rate as well as with oil. A weaker dollar between opening and closing reduces the value of a dollar profit in euros.
Costs to subtract
- Spread paid on entry.
- Financing on cash CFDs held overnight. See how overnight financing works.
- Roll adjustments on futures-based CFDs, which keep equity unchanged at the roll but may carry a fee. See how a futures roll adjusts a commodity CFD price.
Return on margin and on position
The $350 gain in example 1 is about 4.4% of the $8,000 position but about 44% of the $800 margin. Both numbers are correct; they answer different questions. The return on position shows how far oil moved; the return on margin shows how hard leverage worked, in both directions. A $3.50 move against the position would have cost the same 44% of margin.
Profit across a roll
If a futures-based oil CFD rolls while the trade is open, the price on the chart jumps by the gap between contracts, and the provider makes an offsetting cash adjustment. To calculate the real result, combine the price change before the roll, the price change after it and the adjustment, or simply compare equity before opening and after closing, minus any roll charge.
Break-even
A trade needs to move far enough to cover the spread and any financing before it makes money. With a $0.04 spread and three nights of financing worth about $0.04 a barrel, the break-even move is about $0.08 a barrel. Writing the break-even next to the target before entering shows whether the trade is worth taking.
Why sizing matters
Oil can move several dollars a day in volatile periods. A $5 move on 100 barrels is $500, more than half of the 10:1 margin. See how to size a CFD position using risk per trade and how commodity CFDs work.
Sizing from the stop, worked through
Suppose you are willing to lose $150 on an oil trade, and your stop is $1.50 away from entry. Each barrel loses $1.50 if the stop is hit, so the position size is $150 ÷ $1.50 = 100 barrels. If the stop needs to be $3.00 away because oil is volatile that week, the size drops to 50 barrels. The risk stays the same; the position adjusts to the market. See how to read a commodity contract specification.
Worked example 5: a stop that slips
A trader shorts 50 barrels at $75.00 with a stop at $76.00, planning to risk $50. Overnight, news lifts oil, and the market opens at $76.30. The stop fills there, so the loss is 1.30 × 50 = $65, about 30% more than planned. Oil often gaps around supply news and weekend events, so the stop limits losses in normal conditions but cannot guarantee the exit price. See how stop-loss orders work and why they can slip.
Worked example 6: closing in two parts
A long of 100 barrels from $80.00 is closed half at $83.50 and half at $85.00. The first half earns 3.50 × 50 = $175; the second earns 5.00 × 50 = $250. Total gross profit: $425. Calculating each part separately and adding them up gives the right result whatever order the exits come in.
Several trades in one week
| Trade | Gross | Costs | Net |
|---|---|---|---|
| Long 100 bbl, +$3.50 | +$350 | $8 | +$342 |
| Short 50 bbl, stop slipped | −$65 | $2 | −$67 |
| Long 50 bbl, +$1.80 | +$90 | $3 | +$87 |
| Long 100 bbl, −$0.60 | −$60 | $5 | −$65 |
(Illustrative trades.) The week’s net result is about $297. Recording costs per trade, rather than only gross results, shows how much trading frequency and holding time actually cost.
Common calculation errors
- Using a contract size from another provider.
- Forgetting that a short profits when the price falls.
- Ignoring financing on positions held for weeks.
- Treating a roll jump on the chart as a real gain or loss.
Records for tax
In many countries, CFD gains and losses must be reported for tax, often converted into the local currency at specified rates. Keeping each trade’s dates, sizes, prices and costs in one place makes those calculations much simpler at year end. Local rules vary, so checking with a tax adviser is worthwhile.
A quick P&L check
- Is the contract size correct for this provider?
- Is the sign right for a long or a short?
- Have spread, financing and any roll charge been subtracted?
- Has the result been converted into the account currency?
- Does the result match the change in account equity?
The arithmetic is the easy part
The formula is simple. What makes oil results hard to predict is the size of daily moves, gaps around news and weekends, and costs of holding positions through rolls and financing. Planning for those makes the biggest difference to outcomes.
Frequently asked questions
Is the profit different for WTI and Brent CFDs?
The formula is the same, but the two benchmarks have different prices, roll dates and sometimes contract sizes, so the same view can produce different results.
Why does my platform show a slightly different P&L?
Usually because of the spread, financing already charged, a roll adjustment or currency conversion for non-dollar accounts.
Leverage, margin and cost figures in this article are example values for illustration. Actual terms depend on the provider, the instrument and the rules in your country.
This article is educational content and does not constitute financial, investment, legal or tax advice. Digital assets are volatile and you may lose the amount you invest.