
Gold Myths That Mislead New Traders
Six gold myths tested against history: 1980–2001, 2008, 2011–15, March 2020, 2022 and 2026 show gold can fall hard, lag inflation and drop with stocks.

Common gold myths: it always rises in a crisis, always beats inflation, cannot fall sharply, always moves opposite to stocks, costs nothing to hold and ignores interest rates. Tested against gold’s own history, each fails at least once, most recently when gold fell from above $5,200 in February 2026 to near $4,060 by June.
How the myths are tested
Rather than arguing each myth in the abstract, this article walks through six episodes in gold’s modern history, from the 1980 peak to 2026, and notes which beliefs each episode contradicts. Gold has been an excellent long-term asset in many periods, and nothing here argues against owning it. The point is that the simple rules repeated about gold fail often enough to be expensive for anyone who trades on them with leverage. Prices are approximate where no source is given.
1980–2001: two decades of decline
Gold reached about $850 an ounce in January 1980, at the height of the inflation scare that followed the end of dollar-gold convertibility and the oil shocks. Over the next two decades it drifted lower, falling to around $250 by the end of the 1990s, while consumer prices more than doubled. Anyone who bought at the peak lost most of their real wealth for a generation.
Myths contradicted: “gold always beats inflation” and “gold can’t fall sharply.” Over twenty years, gold lost heavily against inflation, because real interest rates were high and inflation was falling.
2008: the first stage of a crisis
As the financial crisis intensified in 2008, gold did not rise steadily. It fell by roughly a quarter between its spring high and the autumn panic, as investors sold whatever they could to raise cash and the dollar surged. Only later, as central banks cut rates and launched bond buying, did gold begin a long rally.
Myths contradicted: “gold always rises in a crisis” and “gold always moves opposite to stocks.” In the acute phase, gold and stocks fell together.
2011–2015: a bull market ends
After peaking near $1,900 in 2011, gold fell for more than four years, losing over 40% by late 2015, as the US economy recovered, the Federal Reserve moved toward raising rates and the dollar strengthened. Inflation was low and stable, removing one of the reasons investors had bought.
Myths contradicted: “rates don’t matter” and “gold can’t fall sharply.” The prospect of higher real yields and a stronger dollar was enough to drive a long decline. See why gold falls when real yields rise.
March 2020: the dash for cash
When the pandemic hit markets, gold gave back nearly 15% over five sessions from its March 9 high, as investors and funds sold liquid assets to meet margin calls and raise dollars. It then recovered strongly, reaching new records later that year.
Myths contradicted: “gold always rises in a crisis” and “gold always moves opposite to stocks.” The first move was down, alongside equities; the haven role returned only after the panic eased.
2022: high inflation, flat gold
In 2022, inflation in the United States and Europe reached its highest levels in four decades. Gold ended the year roughly flat, while a broad commodity basket rose about 18%, led by energy. Rapidly rising real interest rates offset the inflation argument for gold.
Myths contradicted: “gold always beats inflation” and “rates don’t matter anymore.” In the year inflation was highest, the classic inflation hedge did not deliver. See are commodities a good inflation hedge?.
2026: a record, then a fall of more than 20%
Gold set records above $5,100 in January 2026 and traded above $5,200 in late February, supported by central bank buying and geopolitical fear. By late June it was near $4,060, a fall of more than 20% in four months. Positions held with leverage near the top lost far more than that in proportion to their margin.
Myths contradicted: “gold can’t fall sharply” and “gold always rises in a crisis.” The conflict that began in late February did not prevent the decline that followed.
The record in one table
| Episode | Gold’s move | Myths it contradicts |
|---|---|---|
| 1980–2001 | From about $850 to about $250 | Always beats inflation; can’t fall sharply |
| 2008 crisis | Fell about a quarter before rallying | Always rises in a crisis; opposite to stocks |
| 2011–2015 | Fell over 40% | Rates don’t matter; can’t fall sharply |
| March 2020 | Nearly −15% in five sessions | Always rises in a crisis; opposite to stocks |
| 2022 | About flat as inflation peaked | Always beats inflation; rates don’t matter |
| 2026 | More than −20% in four months | Can’t fall sharply; always rises in a crisis |
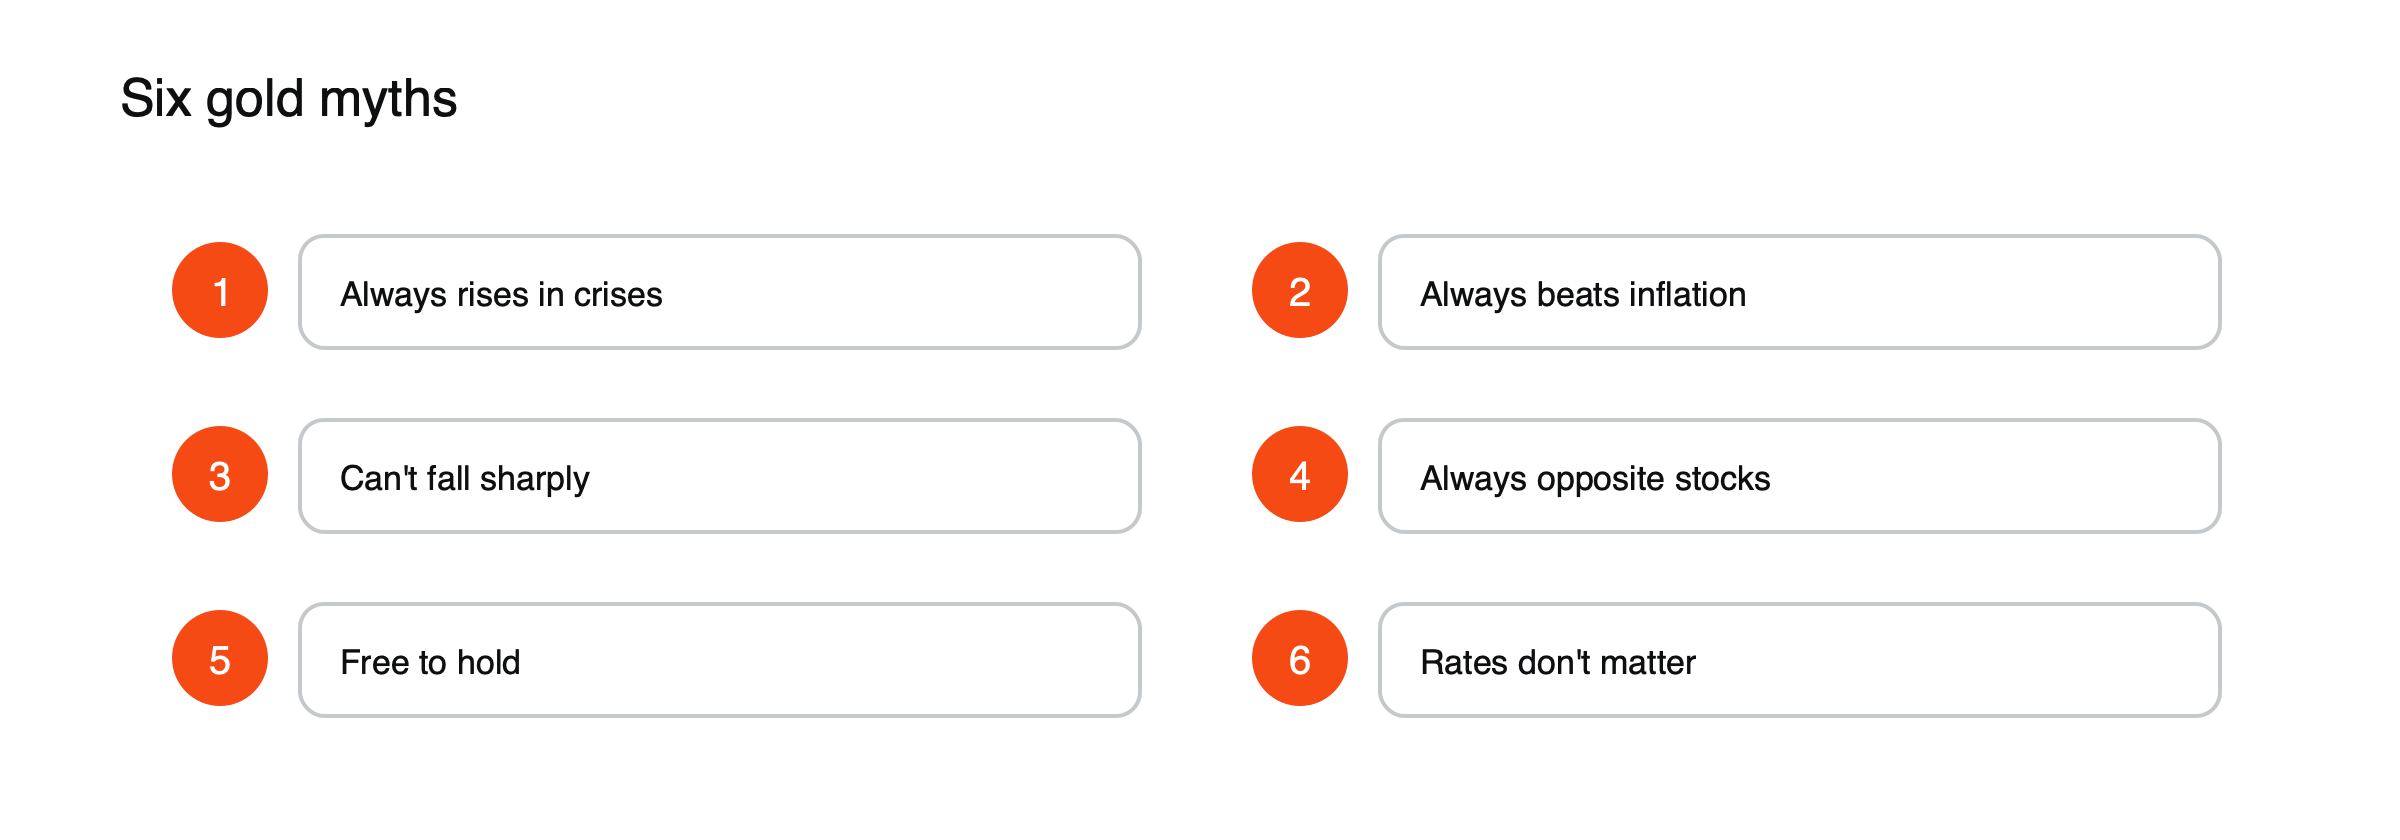
Figure: Six gold myths.
The myth no episode needs: free to hold
One myth fails all the time rather than in particular episodes: the idea that holding gold costs nothing. Physical gold carries storage and insurance costs, funds charge fees and gold CFDs carry overnight financing on the full position value, which on a one-lot position at 2026 prices could amount to around $2,000 a month at an illustrative 6% annual rate. See how CFD overnight financing works.
What survives the test
Across the episodes, gold has repeatedly recovered from its falls and has protected wealth over many long periods, especially when real interest rates were low or falling and confidence in currencies was weak. What fails are the absolute versions: “always,” “never,” “can’t.” Traders who treat gold as one asset with several drivers, rather than as a guaranteed haven, size their positions for the falls that history shows are normal. See what moves gold prices and how commodity CFDs work.
Why the myths persist
Gold’s myths survive because each contains a grain of truth. Gold often does well in crises, over very long periods it has generally held its value and it frequently moves differently from stocks. The trouble comes when tendencies are treated as rules. Marketing for gold products often emphasizes the tendencies, and memorable rallies are retold more often than long declines. A trader who remembers the 2020 and 2025 rallies but not the 2011–2015 fall gets a lopsided picture.
Leverage turns myths into losses
For someone holding physical gold without borrowing, a 20% fall is painful but survivable. For a trader using the maximum 20:1 leverage allowed on gold CFDs for retail clients in the EU, a fall of just 5% equals the entire margin on the position. Each of the episodes above included falls well beyond 5%, which is why believing that gold “can’t fall sharply” is far more dangerous with leverage than without it. See how much margin you need for one lot of gold.
A myth-proof checklist
- What would happen to this position if gold fell 10% in a month?
- Are real yields and the dollar rising or falling?
- Is the current fear the kind that lifts gold or forces selling?
- What will holding the position cost over the planned period?
- Is the position sized for history’s normal falls, not just recent gains?
What the episodes have in common
In almost every episode, gold fell when real interest rates rose, when the dollar strengthened sharply or when investors needed cash quickly. It rose when real rates fell, when confidence in currencies weakened and when steady buyers such as central banks were active. Watching those drivers explains gold’s behavior far better than any single rule about crises or inflation. See why gold and the US dollar usually move in opposite directions.
The long-term and trading views
An investor holding gold for decades, without leverage, can afford to ride out falls of 20% or even 40% if the long-term case holds. A trader using leverage cannot. The same history that supports gold as a long-term holding is a warning for short-term positions, where timing, sizing and costs decide results. Both views can be right at once: gold can be a sound long-term holding and a dangerous leveraged trade, depending on how it is held and how large the position is. Decide which of the two you are doing before choosing position size.
This article is educational content and does not constitute financial, investment, legal or tax advice. Digital assets are volatile and you may lose the amount you invest.
Sources
- March 2020 review and outlook (gold gave back nearly 15% over five sessions from its March 9 high) — Nasdaq
- Gold spot price surges past $5,246 (February 27, 2026) — USAGOLD
- Gold rebounds above $4,060 (June 26, 2026) — USAGOLD
- Commodities are more than just an inflation hedge (2022: commodities +18%, gold about flat) — WisdomTree
- Gold surges past $5,000 and silver tops $100 (record above $5,100 in January 2026) — Barchart, January 2026