
How to Read a Futures Curve
List contract prices by expiry, plot them, check the slope and the near-month spread, then compare with past shapes: how to read a futures curve, step by step.
To read a futures curve, list a commodity’s contract prices by delivery month, plot them nearest to furthest, see whether the line slopes up (contango) or down (backwardation), check the gap between the first two months and compare with past weeks. The shape signals whether supply is ample or tight.
Before you start
Get settlement prices for several consecutive months of the same contract from the exchange or a market data source.
Reading it, step by step
List prices by expiry
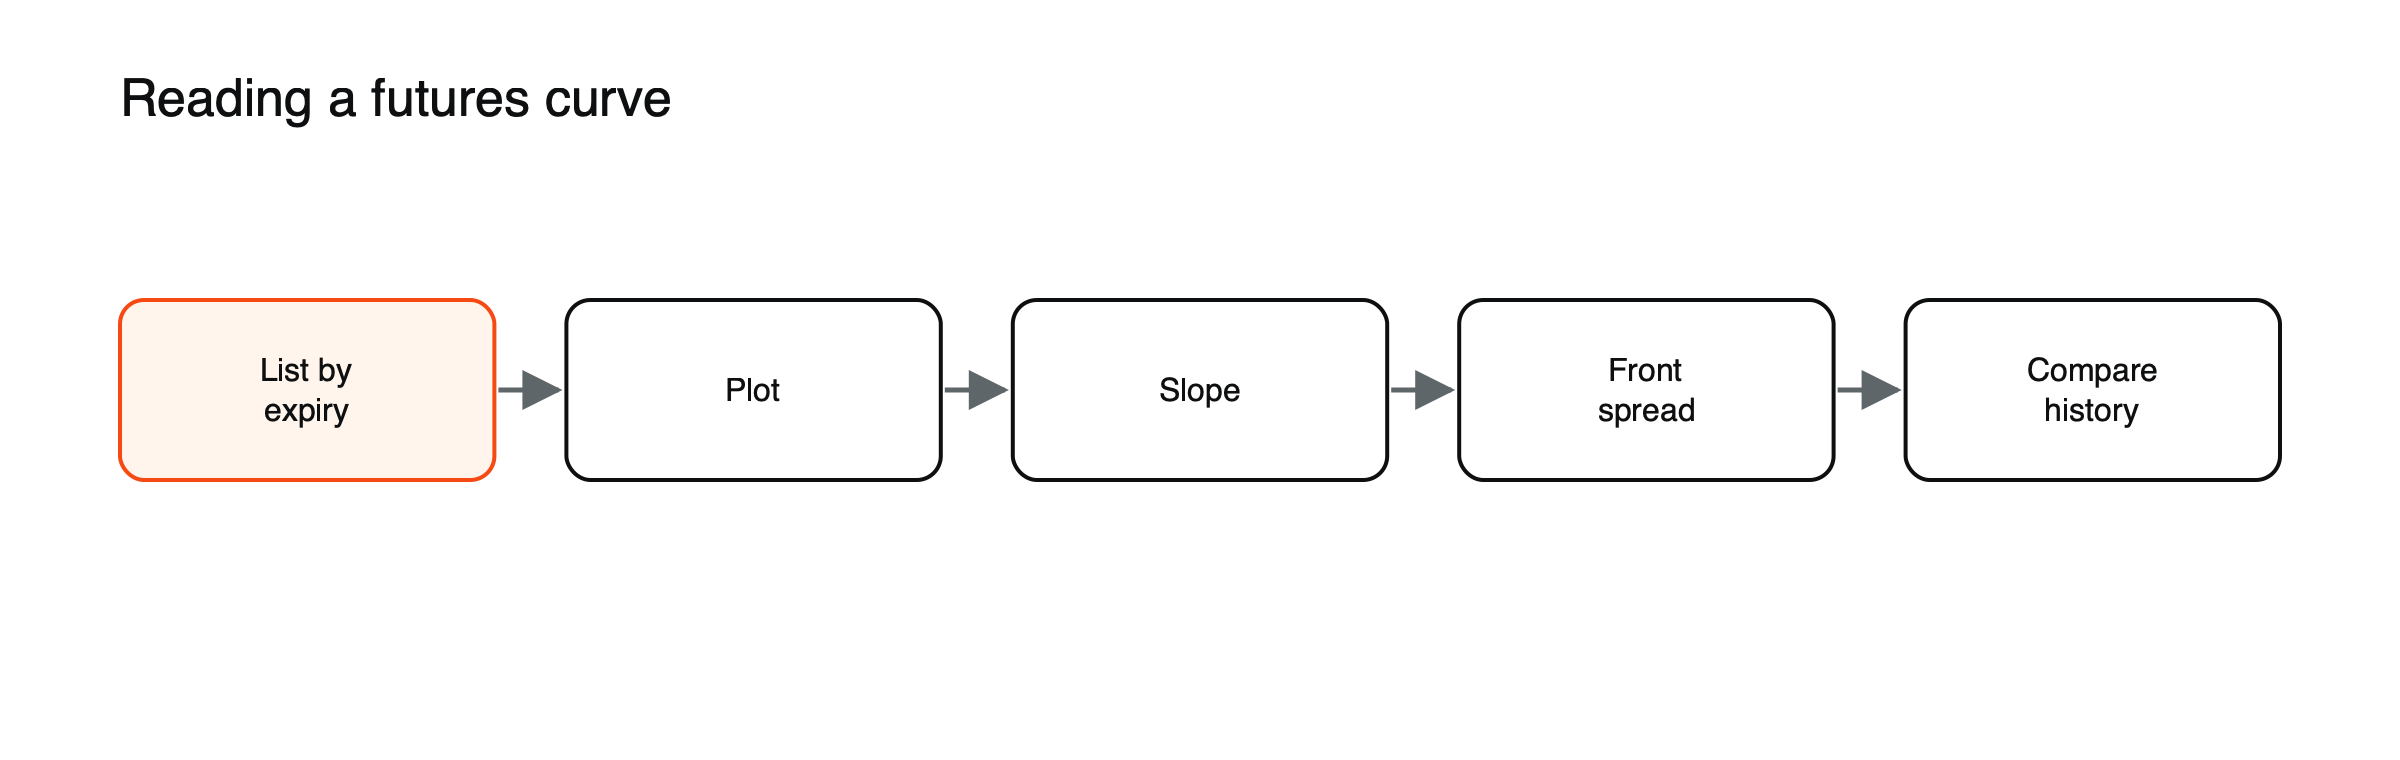
Figure: Reading a futures curve.
Nearest month first, then each following month.
Plot the curve
Delivery date on the horizontal axis, price on the vertical.
Identify the slope
Rising: contango, often ample supply. Falling: backwardation, often tight supply. See what contango and backwardation are.
Check the front spread
The difference between the first two months shows near-term pressure. In April 2020, oil’s May–June gap blew out to more than $58 at settlement.
Compare with history
A shift from backwardation to contango can signal weakening demand, and vice versa.
What it means for positions. A steep contango makes rolling long positions costly; backwardation can help them. See how a futures roll adjusts a commodity CFD price.
A curve, worked through
| Contract | Price |
|---|---|
| Month 1 | $80.00 |
| Month 2 | $80.60 |
| Month 3 | $81.10 |
| Month 4 | $81.50 |
| Month 5 | $81.80 |
| Month 6 | $82.00 |
(Illustrative oil prices.) The curve slopes upward, so the market is in contango. The front spread, between months one and two, is $0.60. Across six months, the curve rises $2.00, or 2.5%. Over a year at that pace, the slope would be worth roughly 6% to 7%, which is about what a long position rolling month after month would give up if the shape stayed the same. The flattening toward the back of the curve suggests that the market sees near-term supply as ample but expects it to balance later.
Shapes beyond a simple slope
Curves are not always straight lines. A curve can be in backwardation for the first few months and contango further out, which often means a short-term shortage that the market expects to ease. Natural gas curves often show seasonal humps, with winter contracts above summer ones. Agricultural curves can step up or down around harvests. Recognizing the normal shape for each commodity is the first step in spotting when something unusual is happening.
What moves the curve
The front of the curve reacts most to current conditions: inventory reports, refinery outages, weather and supply disruptions. The back of the curve reflects longer-term expectations about production costs, investment and demand. When a supply shock hits, the front usually moves much more than the back, steepening backwardation. When demand collapses, the front falls furthest, deepening contango. Watching which part moves tells you whether news is seen as temporary or lasting.
Calendar spreads as indicators
The price difference between two contract months is called a calendar spread. Traders track spreads such as month one versus month two, or December this year versus December next year, because they react quickly to changes in supply and demand. A spread moving from negative to positive, or the reverse, can be an early sign that the market’s balance is shifting, often before the headline price makes it obvious.
Common mistakes
Reading the curve as a forecast of future spot prices, and ignoring that the curve can change shape quickly. See how commodity CFDs work.
Curves for different commodities
Gold’s curve usually sits in mild contango, close to the cost of financing, because the metal is cheap to store. Crude oil swings between contango and backwardation with inventories. Natural gas shows strong seasonality. Industrial metals can move into steep backwardation during shortages, as in some metals squeezes. Comparing a curve with its usual pattern matters more than its absolute shape. See what contango and backwardation are.
Using the curve when planning a trade
Before holding a commodity position for weeks, check the curve. In steep contango, a long position will face roll costs or higher financing, so the expected price move needs to exceed that drag. In backwardation, the curve works in a long position’s favor. For shorts, the effects reverse. The curve does not tell you where prices will go, but it tells you what holding a position will cost along the way.
Where to find the data
Exchanges publish settlement prices for each contract month, and many market data services chart the curve directly. Some brokers show the prices of several months in their platforms. Saving a snapshot of the curve each week makes changes in shape easy to see over time.
The curve in April 2020
The oil market of April 2020 shows how quickly a curve can change shape. As demand collapsed and storage at the delivery hub filled, the expiring May contract settled at minus $37.63 on April 20, while the June contract settled at $20.43. A curve that had been in modest contango became extremely steep at the front within days. Traders who watched the front spread saw the stress building well before the headline price turned negative.
The curve and inventories
Curve shape is closely tied to inventories. When stocks are high, holders need to be paid to keep storing, so later contracts trade above nearby ones and contango appears. When stocks are low, users compete for immediate supply and backwardation appears. Weekly inventory reports therefore often move the front spread as much as the headline price. See how to read the weekly EIA oil inventory report.
A natural gas curve
Natural gas curves usually show a repeating seasonal pattern: winter months priced above summer months, because demand for heating peaks in winter while production stays relatively steady. A trader reading the gas curve looks at whether the winter premium is larger or smaller than usual, rather than whether the curve slopes up or down overall.
Common shapes at a glance
| Shape | What it looks like | Common reading |
|---|---|---|
| Contango | Later months higher | Ample supply, storage costs |
| Backwardation | Later months lower | Tight supply now |
| Steep front contango | Big gap between first two months | Storage strain, weak near-term demand |
| Steep front backwardation | Nearby far above later months | Acute shortage |
| Seasonal humps | Peaks in certain months | Recurring demand cycles |
| Mixed | Backwardation near, contango far | Short-term tightness expected to ease |
(General tendencies; context decides the reading.)
Comparing today’s shape with the same date in previous years, especially for seasonal commodities, shows whether the current curve shape is normal for the time of year or signals an unusual shift in supply and demand.
Frequently asked questions
Does an upward-sloping curve mean prices will rise?
No. Contango mainly reflects storage and financing costs and current supply conditions, not a forecast that spot prices will rise.
Which part of the curve matters most for CFD traders?
Usually the front, because most CFDs track the nearest contract or a near-term cash price, and rolls happen between the first two months.
This article is educational content and does not constitute financial, investment, legal or tax advice. Digital assets are volatile and you may lose the amount you invest.