
Mistakes Traders Make When Reading the VIX
Six VIX mistakes, each from mistaking it for something else: a compass, a price tag, a mirror, a safety rating, a savings account or a clock.
Common VIX mistakes: treating it as a direction forecast, assuming the spot index is tradable, reading a low VIX as safety, ignoring how VIX products lose value over time, selling volatility without limits and calling a spike the exact bottom. Each one comes from mistaking the VIX for something it is not.
What the VIX actually is
The VIX is a number calculated from S&P 500 option prices that expresses how much the market expects the index to move over the next 30 days, as an annualized percentage. It is a measurement, like a thermometer reading of expected turbulence. Every common mistake below treats it as a different kind of instrument.
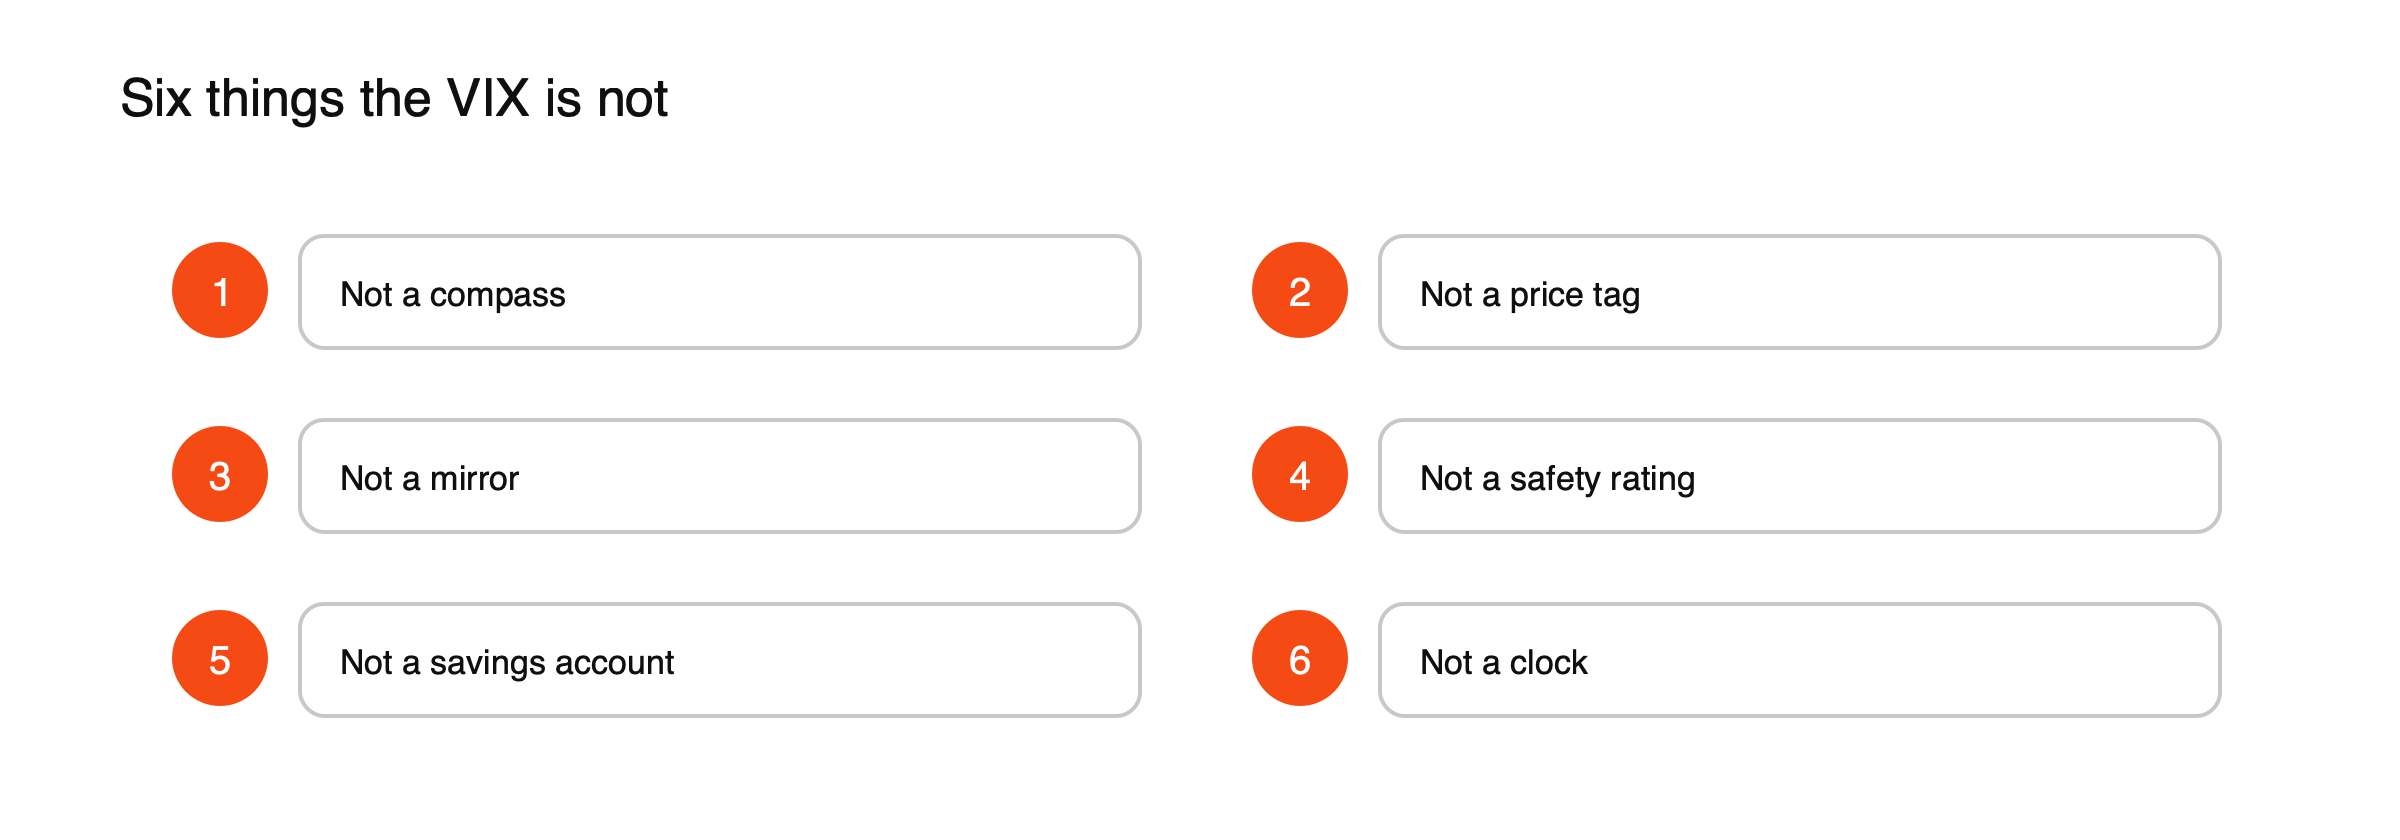
Figure: Six things the VIX is not.
Mistaking it for a compass
A compass tells you which way to go. The VIX does not. A reading of 30 implies expected monthly moves of about 8.7% in either direction, not a 30% fall. The VIX often rises when stocks fall because investors buy protection, but it can also rise in a speculative rally when demand for call options surges.
What it really is: a gauge of the expected size of moves. Use it to judge how large swings may be, not where prices will go.
Mistaking it for a price tag
You cannot buy the VIX itself. Products described as VIX trades follow VIX futures, which reflect expected volatility at future dates and can differ sharply from the spot index. On a day when the spot VIX jumps 30%, near-dated futures might rise 15% and longer-dated ones only 8%. (Illustrative figures.)
What it really is: an index you can watch, but only trade indirectly, through futures-based products with their own behavior.
Mistaking futures products for a mirror
Even traders who know they hold futures often expect the product to track the VIX over time. In calm markets, futures usually trade above the spot VIX. Suppose the spot VIX is 13 and the one-month future 15. If the VIX stays at 13, the future drifts down toward it as expiry approaches, a loss of about 13% for a holder over the month. (Illustrative figures.) Long-volatility products that keep rolling into new futures repeat that loss month after month.
What it really is: a futures curve, whose shape decides whether holding volatility products costs or earns money. See what contango and backwardation are.
Mistaking it for a safety rating
A low VIX feels like a seal of approval. In 2017 and early 2018, the VIX sat near record lows around 9 to 11, and many traders enlarged positions accordingly. On February 5, 2018, it closed at 38.80, a record 20-point jump in one day.
What it really is: today’s expectation of calm, which can change overnight. A low reading says turbulence is not expected, not that it cannot come.
Mistaking short volatility for a savings account
Selling volatility often produces small, steady gains, which can look like interest on a deposit. In February 2018, products that bet on calm markets lost almost all their value in a day, and the feedback loop created by their own rebalancing made the spike worse. See what Volmageddon was.
What it really is: insurance selling. The premiums are regular; the claims are rare and enormous.
Mistaking a spike for a clock
Traders sometimes treat a VIX spike as a signal that the bottom has arrived. On March 16, 2020, the VIX closed at a record 82.69, yet the S&P 500 kept falling for another week before bottoming on March 23. Spikes show that fear is extreme, not that it has finished.
What it really is: a measure of current fear, which can stay high, or go higher, for days or weeks.
The six confusions at a glance
| Treated as | What it actually is | Typical cost of the confusion |
|---|---|---|
| A compass | A gauge of expected move size | Trades in the wrong direction |
| A price tag | An index you cannot buy | Surprise at how products behave |
| A mirror | A futures curve | Steady losses from roll |
| A safety rating | A changeable expectation | Oversized positions before a spike |
| A savings account | Insurance selling | Rare but enormous losses |
| A clock | A measure of current fear | Buying too early in a crash |
Using it as intended
Treat the VIX as context for position size and risk. When it rises, expected index moves rise with it, so the same position carries more risk; reducing size keeps that risk steady. See what the VIX is and how stock index CFDs work.
How the confusions combine, illustrated
Suppose that in a calm year a trader sees the VIX at 11 and concludes markets are safe, the safety-rating confusion. They sell volatility through a product that has earned steady gains, the savings-account confusion, and enlarge index positions at the same time. When volatility suddenly doubles, the short-volatility position collapses and the index positions lose heavily. Seeing the VIX spike above 35, they buy back index exposure, treating the spike as the bottom, the clock confusion, and are caught by a further fall. (Illustrative sequence.) Each mistake on its own is costly; together, they can wipe out an account within weeks.
What to watch instead
Instead of reading the VIX in isolation, combine it with a few related measures. The shape of the VIX futures curve shows whether stress is acute or easing. Realized volatility, how much the index has actually moved, shows whether options are cheap or expensive. Credit spreads and the moves of safe havens such as government bonds and the yen show how widespread the stress is. Together, they give a fuller picture than the VIX alone.
Using VIX levels for sizing, worked through
A trader holds a US index CFD at $2 per point with the index at 5,000, a $10,000 position, while the VIX is around 15. Expected daily moves are then about 0.9%, or roughly $95. If the VIX rises to 30, expected daily moves roughly double to about 1.9%, or $190. To keep the same expected daily swing, the trader could cut the position to $1 per point. (Illustrative figures.) This is the most practical use of the VIX for index traders: adjusting size as risk changes.
Other volatility gauges
Similar indices exist for other markets, such as the VSTOXX for European shares and the VXN for the Nasdaq 100. The same confusions apply to them, and the same remedies: treat them as measures of expected movement, not as direction signals or tradable prices.
Frequently asked questions
Is a high VIX a buying opportunity?
Sometimes markets rebound from periods of very high volatility, but spikes can last for weeks, and buying too early can be costly.
What does a VIX of 20 mean in practice?
That options imply S&P 500 moves of about 5.8% over a month, or about 1.3% on a typical day, in either direction.
Reading VIX headlines
News reports often describe the VIX in dramatic terms, such as a fear index soaring by 50%. Because the VIX starts from a low base in calm periods, large percentage jumps can still leave it at moderate levels, for example from 12 to 18. Checking the actual level, and converting it into expected daily moves, gives a better sense of what the market expects than the headline percentage.
A daily VIX routine
- Note the VIX level and its change since yesterday.
- Convert it into an expected daily index move.
- Check whether the futures curve is normal or inverted.
- Compare with recent realized volatility.
- Adjust position sizes if expected moves have changed meaningfully.
This takes a few minutes and keeps the VIX in its proper role.
When the VIX misleads
The VIX reflects S&P 500 options only. Stress concentrated in other markets, such as bonds, currencies or a single sector, may barely register in it at first. A calm VIX alongside turbulent bond or currency markets is a reason to look wider rather than to relax.
This article is educational content and does not constitute financial, investment, legal or tax advice. Digital assets are volatile and you may lose the amount you invest.
Sources
- The fear gauge: what the VIX tells us (derived from S&P 500 options; expected 30-day moves; record close 82.69 on March 16, 2020; 89.53 intraday in October 2008; lows near 9 in 2017–2018) — Datahub
- The day the VIX doubled: tales of Volmageddon (record 20-point jump on February 5, 2018; XIV collapse) — Bloomberg
- Volatility gauge tops 50 for the first time since Volmageddon (2018 feedback loop in volatility products) — Bloomberg via BNN, March 2020
- COVID-19 market crash 2020 (S&P 500 bottom on March 23 with unlimited QE) — Fin Still