
Large-Cap, Mid-Cap and Small-Cap Stocks Compared
Stocks are grouped by market cap. How large, mid and small caps differ in risk, liquidity, volatility and sensitivity to the economy, and what that means.
Large-cap vs small-cap stocks are grouped by market capitalization, share price times shares outstanding. Large caps are the biggest, most established companies, such as those in the S&P 500. Small caps can grow faster but tend to be more volatile, less liquid and more sensitive to borrowing costs. Size thresholds vary by index.
Side by side
| Large-cap | Mid-cap | Small-cap | |
|---|---|---|---|
| Typical company | Established leaders | Growing, established | Young or niche |
| Volatility | Lower | Medium | Higher |
| Liquidity and spreads | Highest, tightest | Medium | Lower, wider |
| Analyst coverage | Extensive | Moderate | Limited |
| Sensitivity to rates and credit | Lower | Medium | Higher |
| Dividends | More common | Mixed | Less common |
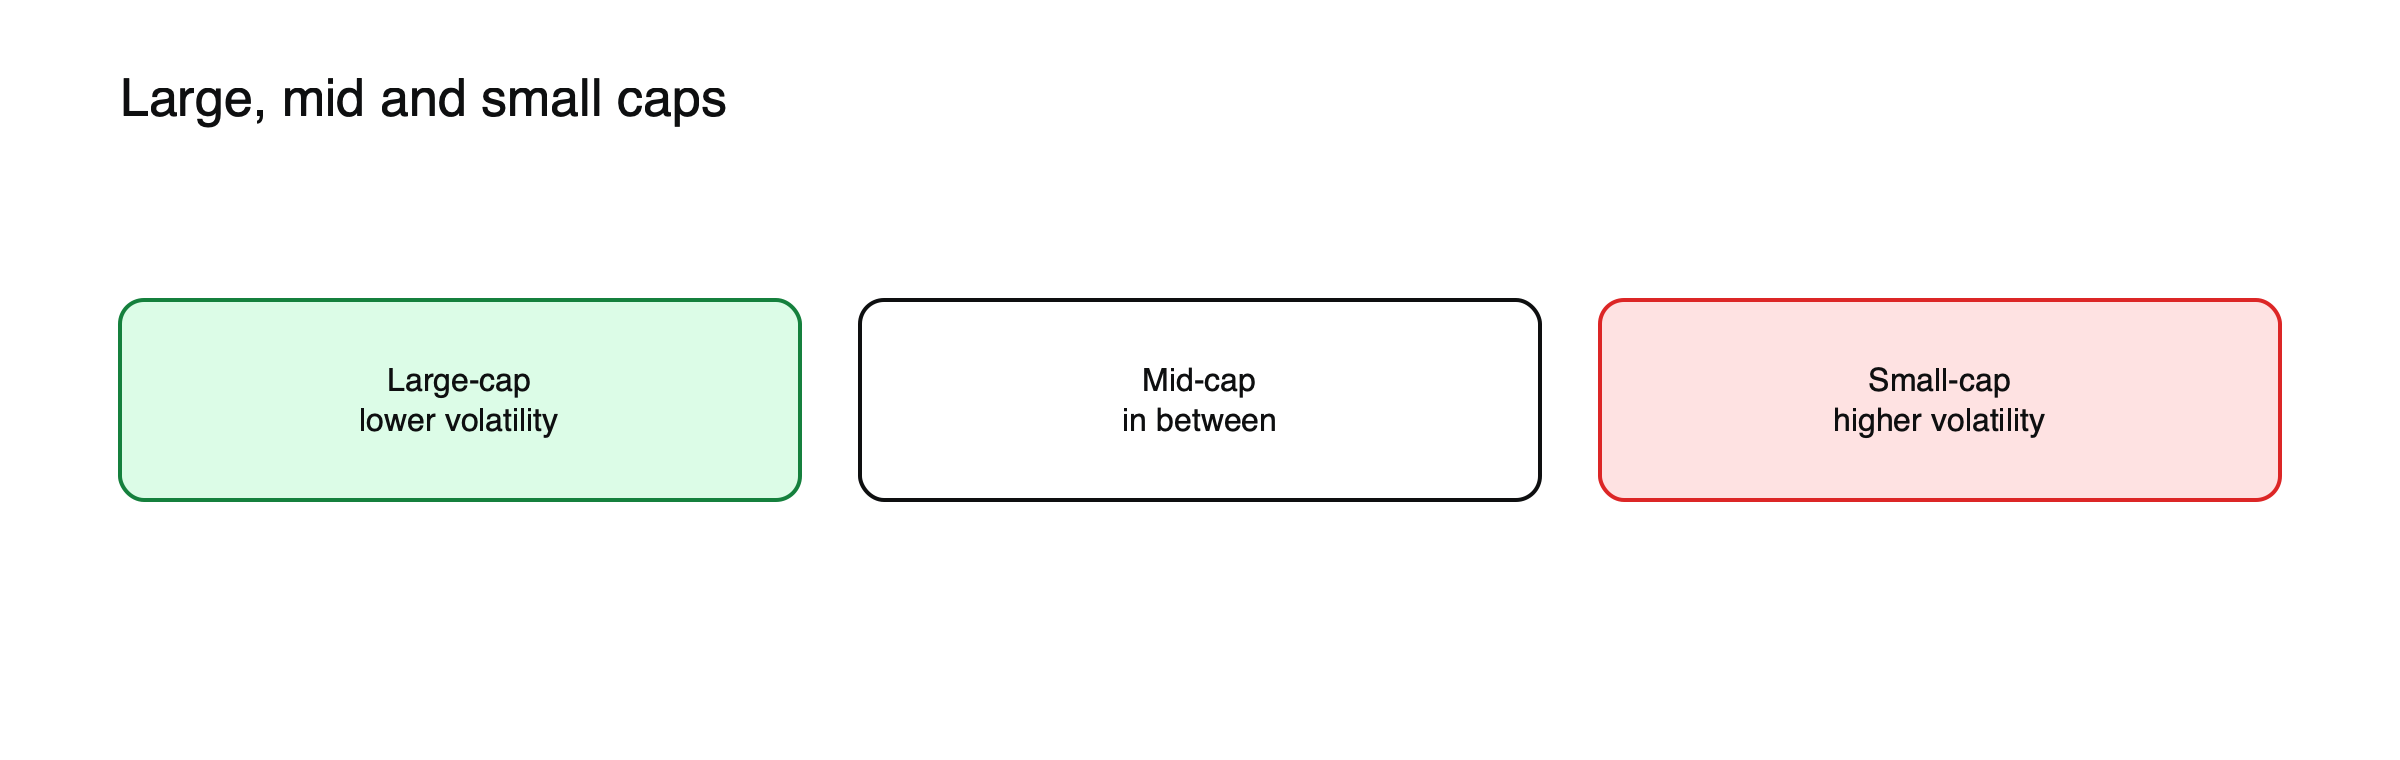
Figure: How risk changes with company size.
Rough size thresholds
There is no official definition, but common US conventions treat companies worth more than about $10 billion as large caps, $2 billion to $10 billion as mid caps and roughly $300 million to $2 billion as small caps, with the very largest called mega caps and the smallest micro caps. Thresholds differ between index providers and countries, and they drift up over time as markets grow.
Indices by size
The S&P 500 tracks large US companies, the Russell 2000 tracks small US companies and in the UK, the FTSE 100 covers the largest listed firms while the FTSE 250 covers mid-sized ones. Comparing these indices shows how size groups are performing against each other, and index CFDs on them let traders take views on size without picking individual shares. See how stock index CFDs work.
Why size matters for traders
Liquidity: smaller stocks can have wider spreads and bigger gaps. See why institutional traders care about market depth.
Volatility: the same position size carries more risk in a small cap; size positions accordingly. See how to calculate your exposure on a stock CFD.
Information: less coverage means more surprises.
Small caps and interest rates, illustrated
Suppose a small company has $200 million of debt at a floating rate, while a large company of similar profitability has fixed-rate bonds maturing in years. If short-term rates rise 3 percentage points, the small company’s annual interest bill rises by about $6 million, which might be a large share of its profit, while the large company’s costs barely change until its bonds come due. (Illustrative figures.) That difference helps explain why small caps often struggle when central banks tighten and recover strongly when rates fall.
The small-cap premium
Early research found that smaller companies’ shares had outperformed larger ones over long periods, which became known as the size premium. In recent decades, the advantage has been much less reliable, and for long stretches large companies, especially the biggest technology firms, have led. Small caps still tend to do well in early economic recoveries.
When big is not safe
Large caps are not always safer: concentrated mega-cap stocks can fall sharply, as Meta did in 2022 when it lost over $200 billion of value in a day.
See what moves stock prices and growth stocks vs value stocks.
The rise of the mega caps
A few very large companies now account for a big share of major US indices. Their size gives them advantages in resources and market power, and their shares are among the most liquid in the world. But concentration means the market’s fortunes depend heavily on a small number of firms, and a single disappointing report can move an entire index. See why tech stocks are so sensitive to bond yields.
Trading costs by size
CFD providers usually offer the widest range of large and mid caps, often with tighter spreads and lower margin rates, while small caps may have wider spreads, higher margins or no CFD at all. Short selling small caps can be difficult or expensive because shares are harder to borrow. Checking these terms before trading smaller companies avoids surprises.
Liquidity, illustrated
For a large US company, the gap between buying and selling prices might be a cent on a $200 share, about 0.005%. For a small company trading at $8, the spread might be five cents, about 0.6%, more than a hundred times larger in relative terms. (Illustrative figures.) A trader buying and selling the small company ten times pays about 6% in spreads alone, a cost that matters far more than in large shares. Gaps on news are also typically larger in smaller companies.
Information and coverage
Large companies are followed by dozens of analysts, and their news is quickly reflected in prices. Small companies may have one or two analysts, or none, so information spreads more slowly and surprises are more common. That can create opportunities for careful research, but it also means more risk of unpleasant surprises for traders who have not looked closely.
Mid caps: the middle ground
Mid-sized companies often combine some of the growth potential of small caps with the stability and liquidity of larger firms. Many have survived their early stages, built established businesses and are still growing. They are sometimes overlooked between the attention paid to large caps and the speculative interest in small ones.
Takeovers
Smaller companies are more often targets of takeovers, because larger firms can afford to buy them and gain new products or markets. Takeover offers usually come at a premium to the market price, which can lift small-cap shares sharply and is a meaningful risk for anyone short.
Common misreadings
- Assuming small caps always grow faster.
- Ignoring spreads and liquidity when trading small companies.
Size and the economic cycle
Small companies usually depend more on their home economy, on bank credit and on a narrow range of products, so their earnings swing more with the business cycle. Large multinationals spread their sales across many countries and products and can borrow cheaply in bond markets. That is why small caps often lead coming out of recessions and lag going into them.
Index changes
As companies grow or shrink, they move between size-based indices, and the funds tracking those indices must buy or sell their shares. Annual and quarterly reconstitutions of small-cap indices can bring large trading volumes and price moves in affected shares around the effective date.
Sizing by company size
A sensible rule is to size positions smaller as companies get smaller, reflecting their higher volatility, wider spreads and larger gaps. A position that would be routine in a mega cap can be a major risk in a small cap of the same value.
Micro caps and penny shares
The smallest listed companies, sometimes worth less than a few hundred million dollars and often trading at very low share prices, carry the highest risks. Information can be scarce, trading thin and prices easy to move, which makes them targets for promotion schemes. Regulators warn investors about aggressive marketing of such shares. CFDs on them are rarely offered, and where they are, spreads and margin requirements are usually high. Treating a share that looks cheap because its price is a few cents as a bargain is a common mistake; the share price says nothing about value without knowing the number of shares and the business behind them.
Frequently asked questions
Are small caps riskier than large caps?
Usually more volatile and less liquid, with more exposure to borrowing costs and the economic cycle. But individual large caps can also fall sharply on company news.
Why do small caps often lead in recoveries?
Because they are more sensitive to economic growth and borrowing costs, they tend to benefit most when the economy improves and rates fall.
This article is educational content and does not constitute financial, investment, legal or tax advice. Digital assets are volatile and you may lose the amount you invest.