
What Moves Stock Market Indices?
Stock indices move on the earnings of their largest members, interest rates, data, currencies, sector mix and flows. How each driver works, with examples.
Stock market indices move on the combined outlook for their members: expected earnings, interest rates, economic data and sentiment. Because most are weighted by market value, the largest companies matter most; the S&P 500’s top 10 were a record 40.7% in 2025. Currencies and sector mix explain why indices react differently.
How an index level is calculated
Most major indices add up the market value of their members, often adjusted for the shares freely available to trade, and divide by a number called a divisor, which the provider adjusts so that events such as new share issues or changes of members do not cause artificial jumps. A 1% rise in a company worth 7% of the index lifts the index by about 0.07%; the same move in a company worth 0.1% barely registers. Price-weighted indices, such as the Dow Jones and the Nikkei 225, work differently, giving more influence to shares with higher prices. See price-weighted vs market-cap-weighted indices.
Earnings of the largest members
A strong or weak report from a mega-cap can move an index by itself. The Magnificent Seven drove most of the S&P 500’s gains in 2023 and 2024. See why a handful of stocks can drive an entire index.
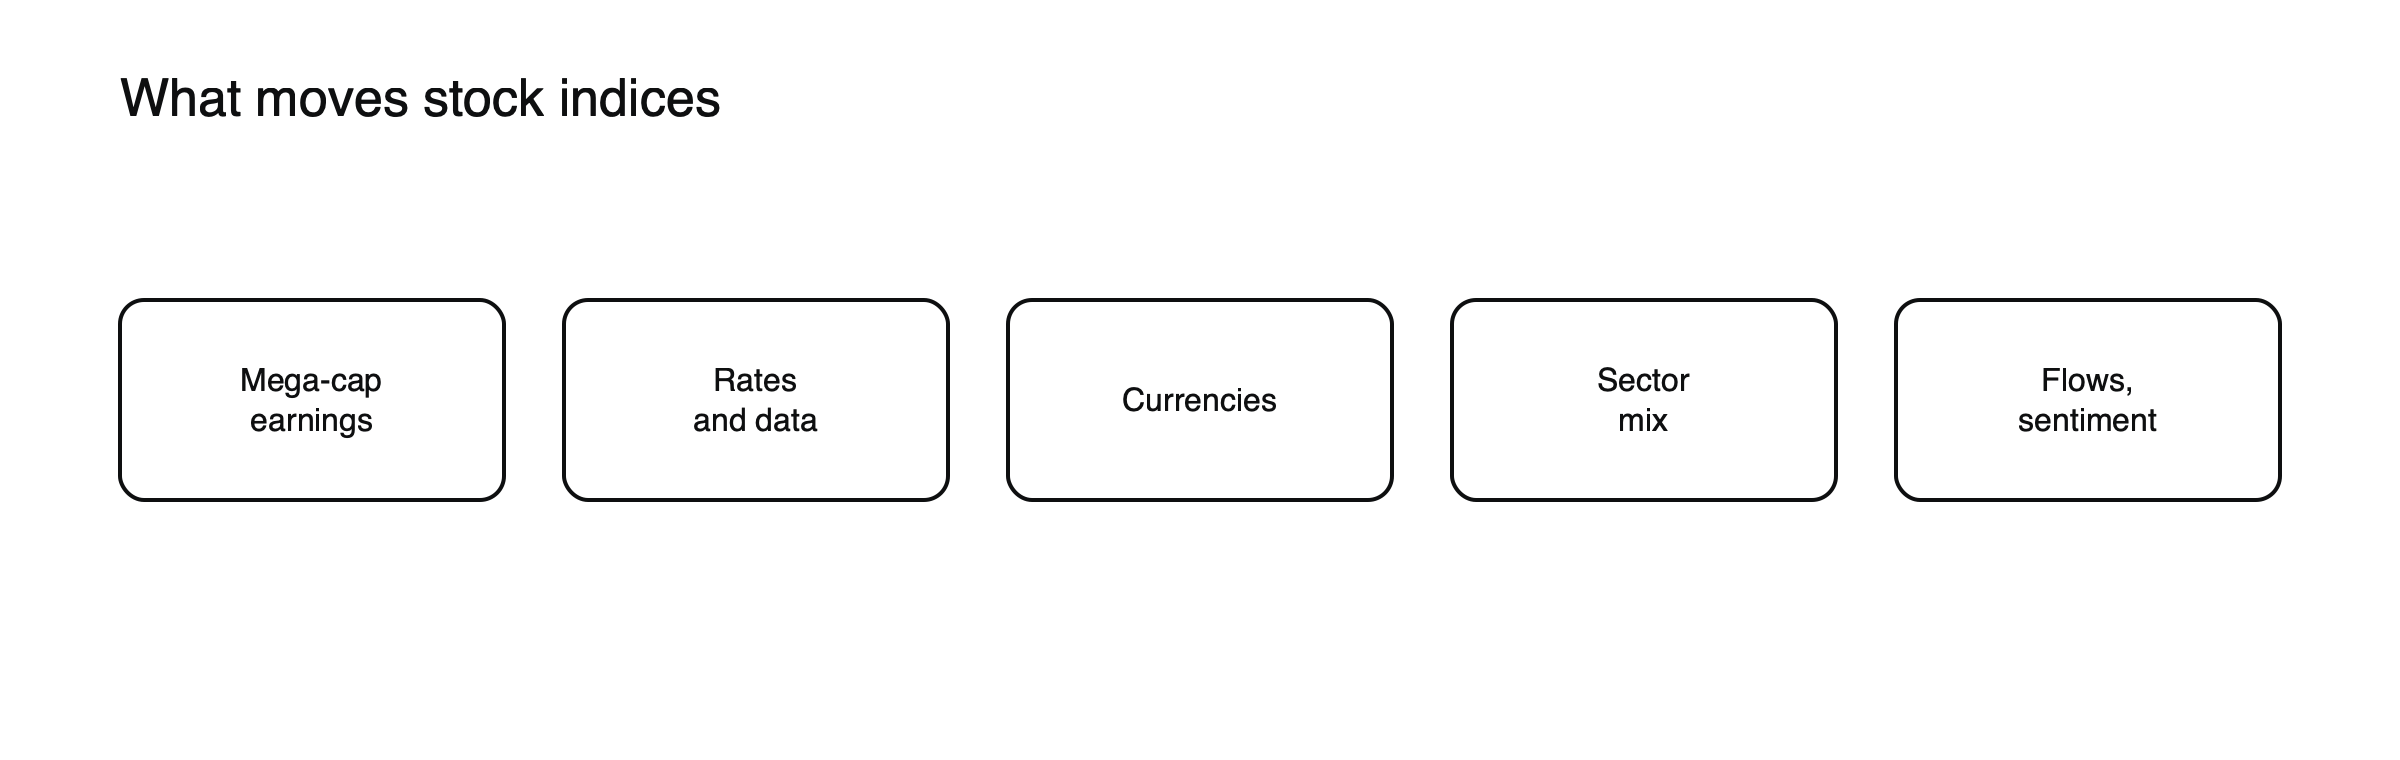
Figure: The main index drivers.
A mega-cap report, illustrated
Suppose a company making up about 7% of the S&P 500 jumps 8% after strong results while the rest of the index is flat. (Illustrative figures.) That single move lifts the index by roughly 0.56%, a solid day’s gain from one company. If two or three of the largest companies report strongly in the same week, the index can rise even while most of its members fall. Index traders therefore follow the earnings calendar of the top members as closely as economic data. See how earnings reports move share prices.
Interest rates and data
Rising yields hurt valuations, especially in tech-heavy indices; inflation, jobs and growth data shift rate expectations. In 2022, US equities fell about 18%. See how interest rates affect stock prices.
Economic data days
Releases such as US jobs, inflation and retail sales move indices because they change expectations for growth and interest rates at once. A strong jobs report can lift cyclical shares but push yields up, hurting rate-sensitive technology shares; the net effect on an index depends on its mix. Indices often move most in the minutes after such releases, and index CFDs trading before the cash open show the reaction immediately. See how to read an economic calendar.
Central bank decisions
Interest rate decisions, and especially the guidance that comes with them, move whole markets. A central bank that signals more hikes than expected can push indices down within minutes; signals of earlier cuts can lift them. Because rate expectations affect the value of all future profits, central bank days often produce larger index moves than most company news. See how central bank decisions move currencies.
Currencies
For indices full of exporters or overseas earners, a weaker home currency can help. See why the FTSE 100 often moves opposite to the pound.
Sector mix
The FTSE 100 leans on energy and mining; the Nasdaq 100 on technology; the DAX on industrials. The same oil price move affects them differently.
Sector mix by index
| Index | Heaviest influences | Sensitive to |
|---|---|---|
| S&P 500 | Technology, healthcare, financials | Rates, technology earnings |
| Nasdaq 100 | Technology and communication services | Real yields, growth outlook |
| FTSE 100 | Energy, mining, banks, consumer staples | Commodities, the pound |
| DAX | Industrials, autos, chemicals, financials | Global trade, China, the euro |
| Nikkei 225 | Exporters, technology hardware | The yen, global demand |
(General tendencies; weights change over time.)
Policy and shocks
Tariff announcements in April 2025 sent the S&P 500 down 12% in four days before a sharp rebound.
April 2025, in more detail
When broad US tariffs were announced in early April 2025, the S&P 500 fell about 12% in four trading days, one of its sharpest short-term declines in years. Within weeks, as some tariffs were paused and negotiations began, the index recovered its losses. The episode showed how policy decisions can move indices as violently as financial crises, and how quickly sentiment can reverse when the policy outlook changes.
Flows and sentiment
Fund flows, index rebalancing and volatility-driven selling can move indices beyond fundamentals in the short run. See how index rebalancing works and what the VIX is.
See how stock index CFDs work.
Volatility and fear
When investors become fearful, volatility rises and indices tend to fall, often sharply. The VIX index, which measures expected volatility in the S&P 500 from options prices, typically jumps during sell-offs. High volatility changes behavior: funds that target a fixed level of risk sell when volatility rises, adding to declines, and buy back when it falls, supporting recoveries. See what the VIX is.
Flows that move indices
Beyond news, several regular flows affect indices: buybacks by member companies, money moving into and out of index funds, pension fund rebalancing at month and quarter ends and the expiry of options and futures, which can bring heavy trading on certain days. These flows rarely set the long-term direction but can explain sharp moves on days without obvious news.
Global connections
Markets hand over to each other around the clock. A sharp fall in US indices often leads to weaker openings in Asia and then Europe, and overnight futures show how investors are reacting before each cash market opens. Global shocks, such as major policy announcements or geopolitical events, tend to move all indices together, while local news, such as a domestic election or currency move, creates differences between them. See how to plan index trades around market opens.
Drivers by time horizon
| Horizon | Main drivers |
|---|---|
| Minutes to hours | Economic data, central bank decisions, mega-cap results, headlines |
| Days to weeks | Earnings season, rate expectations, flows, volatility |
| Months | Interest rate cycle, economic growth, policy changes |
| Years | Long-term earnings growth, valuations, demographics and technology |
A checklist before an index trade
- Which large members report soon, and how heavy are their weights?
- Which economic releases and central bank decisions fall in the holding period?
- What are bond yields and the index’s home currency doing?
- How elevated is volatility?
- How concentrated is the index in one sector or a few companies?
Valuation of the whole index
An index has its own price-to-earnings ratio, the combined market value of its members divided by their combined earnings. When the index’s P/E is high relative to its history, future returns depend more heavily on earnings growth continuing and interest rates staying favorable, and disappointments can produce larger falls. When it is low, much bad news may already be priced in. Index valuations do not time markets, but they shape how sensitive indices are to surprises. See how to calculate and read a P/E ratio.
Earnings revisions
Between results, analysts keep updating their forecasts for index members. When forecasts for the index as a whole are rising, indices tend to have a supportive backdrop; when they are falling, rallies tend to fade. Data providers publish aggregate revisions, and many investors watch them as a guide to the earnings trend that ultimately drives indices.
When bad news is good news
Sometimes indices rise on weak economic data, because softer data make interest rate cuts more likely, which supports valuations. At other times, the same weak data push indices down, because investors worry more about earnings than about rates. Which reaction dominates depends on whether inflation or growth is the market’s main concern at the time, which is why the same kind of release can move indices in opposite directions in different years.
Elections and politics
Elections, budgets and policy changes can move indices, especially when they affect taxes, regulation, trade or government spending. Markets usually price the most likely outcome in advance, so surprises matter most. Policy uncertainty itself tends to raise volatility, even before any decision is made.
Corrections are normal
Declines of 10% or more from a recent high, often called corrections, happen regularly in major indices, even in long bull markets. Knowing that such falls are a normal part of index behavior helps keep positions sized for them rather than for the calm periods in between.
Common misreadings
- Assuming an index reflects the average company.
- Treating every data release as having a fixed effect.
- Ignoring currency effects on indices full of exporters.
Oil and other commodities
Commodity prices affect indices through their members. Rising oil prices lift energy companies, which carry large weights in the FTSE 100, while raising costs for airlines, chemicals and consumers, which weigh on other indices. A sharp oil spike driven by a supply shock can push inflation expectations and bond yields higher, hurting rate-sensitive indices such as the Nasdaq 100. See what moves crude oil prices.
The dollar’s influence
A strong dollar reduces the dollar value of US companies’ foreign earnings, which can weigh on the S&P 500, where many members earn much of their revenue abroad. For indices in other countries, a strong dollar can help exporters but hurt companies with dollar debts. Currency moves are therefore part of the backdrop for every index, not only those with obvious export exposure.
Trends and technical levels
Many traders watch round numbers, previous highs and lows and moving averages on major indices. These levels have no fundamental meaning, but because so many participants watch them, they can attract orders and influence short-term moves. Breaks of widely watched levels sometimes trigger bursts of buying or selling as stops are hit. Using them alongside the fundamental drivers, rather than instead of them, gives a more complete picture of how an index behaves.
Frequently asked questions
Why can an index rise while most of its stocks fall?
Because in market-cap-weighted indices, a few very large companies can outweigh many smaller ones. Strong moves in the biggest members can lift the index even on a day when most members decline.
Why do different indices react differently to the same news?
Because their sector mix, home currencies and company sizes differ. A rise in oil prices may lift the FTSE 100 while hurting indices dominated by technology or consumer companies.
What moves indices most over the long run?
The growth of company earnings, combined with changes in the valuations investors are willing to pay, which depend heavily on interest rates.
This article is educational content and does not constitute financial, investment, legal or tax advice. Digital assets are volatile and you may lose the amount you invest.
Sources
- Stock market concentration statistics (top 10 a record 40.7% in 2025; Magnificent Seven share of returns) — Walnut, 2026
- Commodities are more than just an inflation hedge (US equities −18% in 2022) — WisdomTree
- How the stock market made back its losses after the trade war escalated (S&P 500 −12% in four days, April 2025) — AP via Fortune
- All you need to know about the DAX (FTSE 100 overseas earners; currency effects) — Pepperstone